Elliptical Isophote Analysis (photutils.isophote)#
Introduction#
The isophote package provides tools to fit elliptical
isophotes to a galaxy image. The isophotes in the image are measured
using an iterative method described by Jedrzejewski (1987; MNRAS 226,
747).
See the documentation of the Ellipse
class for details about the algorithm. Please also see the
Isophote Frequently Asked Questions.
Getting Started#
For this example, let’s create a simple simulated galaxy image:
>>> import numpy as np
>>> from astropy.modeling.models import Gaussian2D
>>> from photutils.datasets import make_noise_image

>>> g = Gaussian2D(100.0, 75, 75, 20, 12, theta=np.deg2rad(40.0))
>>> ny = nx = 150
>>> y, x = np.mgrid[0:ny, 0:nx]
>>> noise = make_noise_image((ny, nx), distribution='gaussian', mean=0.0,
...                          stddev=2.0, seed=1234)
>>> data = g(x, y) + noise
(Source code, png, hires.png, pdf, svg)

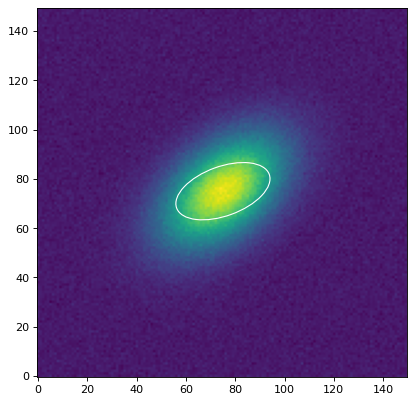
We must provide the elliptical isophote fitter with an initial ellipse
to be fitted. This ellipse geometry is defined with the
EllipseGeometry class. Here we’ll define an
initial ellipse whose position angle is offset from the data:
>>> from photutils.isophote import EllipseGeometry
>>> geometry = EllipseGeometry(x0=75, y0=75, sma=20, eps=0.5,
...                            pa=np.deg2rad(20.0))
Let’s show this initial ellipse guess:
>>> import matplotlib.pyplot as plt
>>> from photutils.aperture import EllipticalAperture
>>> aper = EllipticalAperture((geometry.x0, geometry.y0), geometry.sma,
...                           geometry.sma * (1 - geometry.eps),
...                           theta=geometry.pa)
>>> fig, ax = plt.subplots()
>>> ax.imshow(data, origin='lower')
>>> aper.plot(color='white')
(Source code, png, hires.png, pdf, svg)
Next, we create an instance of the Ellipse
class, inputting the data to be fitted and the initial ellipse
geometry object:
>>> from photutils.isophote import Ellipse
>>> ellipse = Ellipse(data, geometry=geometry)
To perform the elliptical isophote fit, we run the
fit_image() method:
>>> isolist = ellipse.fit_image()
The result is a list of isophotes as an
IsophoteList object, whose attributes are the
fit values for each Isophote sorted by the
semimajor axis length. Let’s print the fit position angles
(radians):
>>> print(isolist.pa)
[ 0.          0.16838914  0.18453378  0.20310945  0.22534975  0.25007781
  0.28377499  0.32494582  0.38589202  0.40480013  0.39527698  0.38448771
  0.40207495  0.40207495  0.28201524  0.28201524  0.19889817  0.1364335
  0.1364335   0.13405719  0.17848892  0.25687327  0.35750355  0.64882699
  0.72489435  0.91472008  0.94219702  0.87393299  0.82572916  0.7886367
  0.75523282  0.7125274   0.70481612  0.7120097   0.71250791  0.69707669
  0.7004807   0.70709823  0.69808124  0.68621341  0.69437566  0.70548293
  0.70427021  0.69978326  0.70410887  0.69532744  0.69440413  0.70062534
  0.68614488  0.7177538   0.7177538   0.7029571   0.7029571   0.7029571 ]
We can also show the isophote values as a table, which is again sorted
by the semimajor axis length (sma):
>>> print(isolist.to_table())
     sma            intens        intens_err   ... flag n_iter stop_code
                                               ...
-------------- --------------- --------------- ... ---- ----- ---------
           0.0   102.237692914             0.0 ...    0     0         0
0.534697261283   101.212218041 0.0280377938856 ...    0    10         0
0.588166987411   101.095404456  0.027821598428 ...    0    10         0
0.646983686152   100.971770355 0.0272405762608 ...    0    10         0
0.711682054767   100.842254551 0.0262991125932 ...    0    10         0
           ...             ...             ... ...  ...   ...       ...
  51.874849202   3.44800874483 0.0881592058138 ...    0    50         2
 57.0623341222   1.64031530995 0.0913122295433 ...    0    50         2
 62.7685675344  0.692631010404 0.0786846787635 ...    0    32         0
 69.0454242879  0.294659388337 0.0681758007533 ...    0     8         5
 75.9499667166 0.0534892334515 0.0692483210903 ...    0     2         5
Length = 54 rows
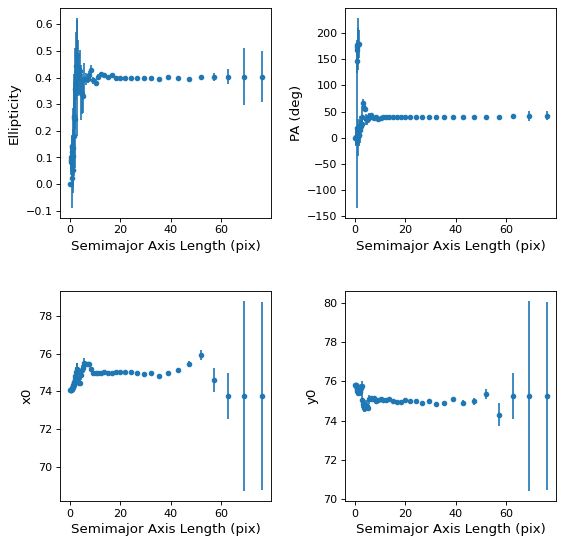
Let’s plot the ellipticity, position angle, and the center x and y position as a function of the semimajor axis length:
(Source code, png, hires.png, pdf, svg)
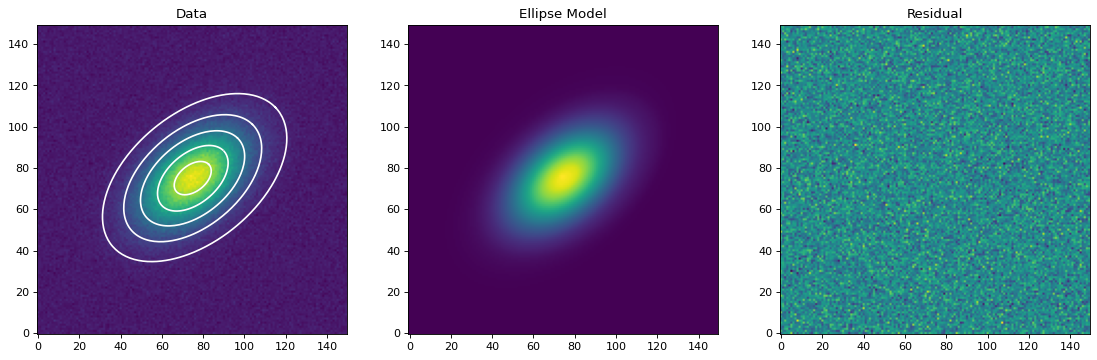
We can build an elliptical model image from the
IsophoteList object using the
build_ellipse_model() function:
>>> from photutils.isophote import build_ellipse_model
>>> model_image = build_ellipse_model(data.shape, isolist)
>>> residual = data - model_image
Finally, let’s plot the original data, overplotted with some isophotes, the elliptical model image, and the residual image:
(Source code, png, hires.png, pdf, svg)
Additional Example Notebooks (online)#
Additional example notebooks showing examples with real data and advanced usage are available online:
API Reference#
Elliptical Isophote Analysis (photutils.isophote)