Morphological Properties (photutils.morphology)#
Introduction#
The photutils.morphology subpackage provides tools to calculate the
morphological properties of sources in an image. These properties
include the shape, size, and orientation of sources, as well as the Gini
coefficient of the flux distribution. The morphological properties can
be used to characterize sources and to define apertures for photometry.
For example, the shape and orientation of a source can be used to define
an elliptical aperture that approximates the isophotal extent of the
source.
The two main functions in the photutils.morphology subpackage
are data_properties() and
gini(). The former calculates the basic
morphological properties of a source in a cutout image, while the latter
calculates the Gini coefficient of the distribution of absolute flux
values in a cutout image. Both functions can be used with an optional
boolean mask to exclude pixels from the calculation.
Data Properties#
The data_properties() function can be
used to calculate the basic morphological properties (e.g., centroid,
semimajor and semiminor axis lengths, orientation) of a single source in
a cutout image. data_properties() returns
a scalar SourceCatalog object (single
source). Please see SourceCatalog for
the list of the many properties that are calculated.
Let’s extract a single object from a synthetic dataset and calculate its morphological properties. For this example, we will subtract the background using simple sigma-clipped statistics.
First, we create the source image and subtract its background:
>>> from astropy.stats import sigma_clipped_stats
>>> from photutils.datasets import make_4gaussians_image
>>> data = make_4gaussians_image()[40:80, 75:105]
>>> mean, median, std = sigma_clipped_stats(data, sigma=3.0)
>>> data -= median  # subtract background
Then, use data_properties() to calculate its
properties. We define a mask to isolate the source pixels by excluding
pixels below a flux threshold:
>>> from photutils.morphology import data_properties
>>> mask = data < 50  # isolate source pixels
>>> cat = data_properties(data, mask=mask)
The morphological properties are stored in a scalar
SourceCatalog object, which can be
converted to an astropy.table.Table object for easier access and
display. For example, we can display the centroid, semimajor and
semiminor axis lengths, and orientation of the source:
>>> columns = ['label', 'x_centroid', 'y_centroid', 'semimajor_axis',
...            'semiminor_axis', 'orientation']
>>> tbl = cat.to_table(columns=columns)
>>> tbl['x_centroid'].info.format = '.6f'  # optional format
>>> tbl['y_centroid'].info.format = '.6f'
>>> tbl['semimajor_axis'].info.format = '.6f'
>>> tbl['semiminor_axis'].info.format = '.6f'
>>> tbl['orientation'].info.format = '.6f'
>>> print(tbl)
label x_centroid y_centroid semimajor_axis semiminor_axis orientation
                                 pix            pix           deg
----- ---------- ---------- -------------- -------------- -----------
    1  15.020335  20.087603       5.597273       3.226091   59.689629
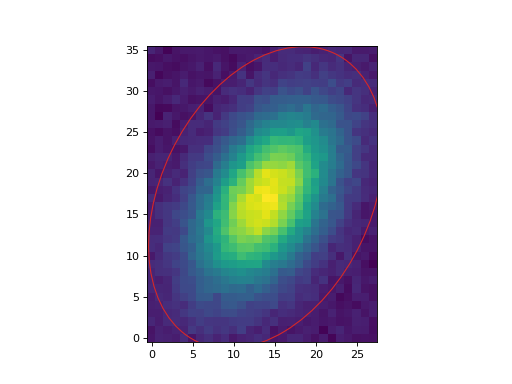
Now let’s use the measured morphological properties to define an approximate isophotal ellipse for the source:
(Source code, png, hires.png, pdf, svg)
Gini Coefficient#
The gini() function can be used to calculate
the Gini coefficient of a source in an image. The Gini coefficient is
a measure of the inequality in the distribution of flux values in an
image. The Gini coefficient ranges from 0 to 1, where 0 indicates that
the flux is equally distributed among all pixels and 1 indicates that
the flux is concentrated in a single pixel. The Gini coefficient can
be used to characterize the concentration of flux in a source and to
compare the morphological properties of different sources. For example,
a source with a high Gini coefficient may be more compact and have
a more concentrated flux distribution than a source with a low Gini
coefficient.
The gini() function calculates the Gini
coefficient of the distribution of absolute flux values of a single
source using the values in a cutout image. The input array may be
1D or 2D. Negative pixel values are used via their absolute value.
Invalid values (NaN and inf) are automatically excluded from the
calculation. An optional boolean mask can be used to exclude pixels from
the calculation.
Let’s calculate the Gini coefficient of the source in the above example:
>>> from photutils.morphology import gini
>>> g = gini(data, mask=mask)
>>> print(g)
0.21943786993407582