Datasets and Simulation (photutils.datasets)#
Introduction#
photutils.datasets provides tools for loading datasets or making
simulated data. These tools mostly involve astronomical images, but they
also include PSF models and source catalogs.
These datasets are useful for the Photutils documentation examples, tests, and benchmarks. However, they can also be used for general data analysis or for users that would like to try out or implement new methods for Photutils.
Functions that start with make_* generate simulated data.
Typically one would need to use a combination of these functions
to create a simulated image. For example, one might use
make_model_params() to create a table of
source parameters, then use make_model_image()
to create an image of the sources, add noise using
make_noise_image(), and finally create a world
coordinate system (WCS) using make_wcs(). An
example of this process is shown below.
Functions that start with load_* load datasets, either from within
the Photutils package or remotely from a GitHub repository. Very
small data files are bundled with Photutils and are guaranteed to be
available. Larger datasets are available from the astropy-data
repository. On first load, these larger datasets will be downloaded and
placed into the Astropy cache on the user’s machine.
Simulating Images#
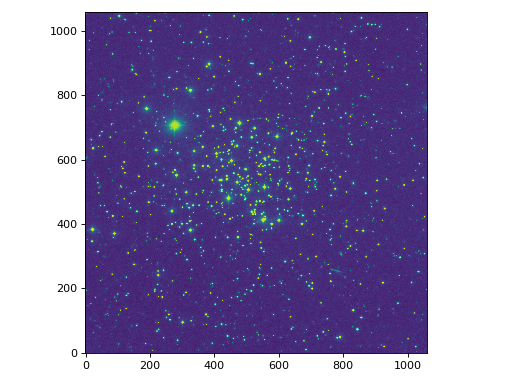
For this example, let’s simulate an image of 2D Gaussian sources on a constant background with Gaussian noise.
First, we’ll create a table of 2D Gaussian source
parameters with random positions, fluxes, and shapes using
make_model_params():
>>> from photutils.datasets import make_model_params
>>> from photutils.psf import GaussianPSF
>>> model = GaussianPSF()
>>> shape = (500, 500)
>>> n_sources = 500
>>> params = make_model_params(shape, n_sources, x_name='x_0',
...                            y_name='y_0', min_separation=5,
...                            flux=(100, 500), x_fwhm=(1, 3),
...                            y_fwhm=(1, 3), theta=(0, 90), seed=123)
Next, we’ll create a simulated image of the sources using the table of
model parameters using make_model_image():
>>> from photutils.datasets import make_model_image
>>> model_shape = (25, 25)
>>> data = make_model_image(shape, model, params, model_shape=model_shape,
...                         x_name='x_0', y_name='y_0')
Next, let’s add a constant background (mean = 5) and Gaussian noise
(stddev = 2) to the image:
>>> from photutils.datasets import make_noise_image
>>> noise = make_noise_image(shape, distribution='gaussian', mean=5,
...                          stddev=2, seed=123)
>>> data += noise
Finally, let’s plot the simulated image:
import matplotlib.pyplot as plt
from astropy.visualization import simple_norm
from photutils.datasets import (make_model_image, make_model_params,
                                make_noise_image)
from photutils.psf import GaussianPSF

model = GaussianPSF()
shape = (500, 500)
n_sources = 500
params = make_model_params(shape, n_sources, x_name='x_0',
                           y_name='y_0', min_separation=5,
                           flux=(100, 500), x_fwhm=(1, 3),
                           y_fwhm=(1, 3), theta=(0, 90), seed=123)
model_shape = (25, 25)
data = make_model_image(shape, model, params, model_shape=model_shape,
                        x_name='x_0', y_name='y_0')

noise = make_noise_image(shape, distribution='gaussian', mean=5,
                         stddev=2, seed=123)
data += noise

fig, ax = plt.subplots()
norm = simple_norm(data, 'sqrt', percent=99)
ax.imshow(data, norm=norm, origin='lower')
ax.set_title('Simulated image')
(Source code, png, hires.png, pdf, svg)
We can also create a simulated world coordinate system (WCS) for the
image using make_wcs():
>>> from photutils.datasets import make_wcs
>>> wcs = make_wcs(shape)
>>> wcs.pixel_to_world(0, 0)
<SkyCoord (ICRS): (ra, dec) in deg
(197.8899676, -1.3750039)>
or a generalized WCS using make_gwcs():
>>> from photutils.datasets import make_gwcs
>>> gwcs = make_gwcs(shape)
>>> gwcs.pixel_to_world(0, 0)
<SkyCoord (ICRS): (ra, dec) in deg
(197.8899676, -1.3750039)>