Centroids (photutils.centroids)#
Introduction#
photutils.centroids provides several functions to calculate the
centroid of one or more sources.
The following functions calculate the centroid of a single source:
centroid_com(): Calculates the centroid as the flux-weighted center of mass derived from image moments.centroid_quadratic(): Calculates the centroid by fitting a 2D quadratic polynomial to the data.centroid_1dg(): Calculates the centroid by fitting 1D Gaussians to the marginalxandydistributions of the data.centroid_2dg(): Calculates the centroid by fitting a 2D Gaussian to the 2D distribution of the data.
Masks can be input into each of these functions to mask bad pixels. Error arrays can be input into the two Gaussian fitting methods to weight the fits. Non-finite values (e.g., NaN or inf) in the data or error arrays are automatically masked.
To calculate the centroids of many sources in an image, use the
centroid_sources() function. This function
can be used with any of the above centroiding functions or a custom
user-defined centroiding function.
Centroid of single source#
Let’s extract a single object from a synthetic dataset and find its centroid with each of these methods. First, let’s create the data:
>>> import numpy as np
>>> from photutils.datasets import make_4gaussians_image
>>> from photutils.centroids import (centroid_1dg, centroid_2dg,
...                                  centroid_com, centroid_quadratic)
>>> data = make_4gaussians_image()
(Source code, png, hires.png, pdf, svg)
Next, we need to subtract the background from the data. For this example, we’ll estimate the background by taking the median of a blank part of the image:
>>> data -= np.median(data[0:30, 0:125])
The data is a 2D image of four Gaussian sources. Let’s extract a single object from the data:
>>> data = data[40:80, 70:110]
Now we can calculate the centroid of the object using each of the centroiding functions:
>>> x1, y1 = centroid_com(data)
>>> print(np.array((x1, y1)))
[19.9796724  20.00992593]
>>> x2, y2 = centroid_quadratic(data)
>>> print(np.array((x2, y2)))
[19.94009505 20.06884997]
>>> x3, y3 = centroid_1dg(data)
>>> print(np.array((x3, y3)))
[19.96553246 20.04952841]
>>> x4, y4 = centroid_2dg(data)
>>> print(np.array((x4, y4)))
[19.9851944  20.01490157]
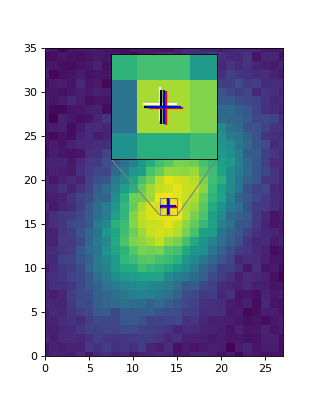
The measured centroids are all very close to the object’s true centroid
at position (20, 20) in the cutout image.
Now let’s plot the results. Because the centroids are all very similar, we also include an inset plot zoomed in near the centroid:
(Source code, png, hires.png, pdf, svg)
Centroiding several sources in an image#
The centroid_sources() function can be used
to calculate the centroids of many sources in a single image given
initial guesses for their central positions. This function can be used
with any of the above centroiding functions or a custom user-defined
centroiding function.
For each source, a cutout image of size box_size is made centered at
each initial position. Optionally, a non-rectangular local footprint
mask can be input instead of box_size. The centroids for each source
are then calculated within their cutout images:
>>> import numpy as np
>>> from photutils.centroids import centroid_2dg, centroid_sources
>>> from photutils.datasets import make_4gaussians_image
>>> data = make_4gaussians_image()
>>> data -= np.median(data[0:30, 0:125])
>>> x_init = (25, 91, 151, 160)
>>> y_init = (40, 61, 24, 71)
>>> x, y = centroid_sources(data, x_init, y_init, box_size=25,
...                         centroid_func=centroid_2dg)
>>> print(x)
[ 24.96807828  89.98684636 149.96545721 160.18810915]
>>> print(y)
[40.03657613 60.01836631 24.96777946 69.80208702]
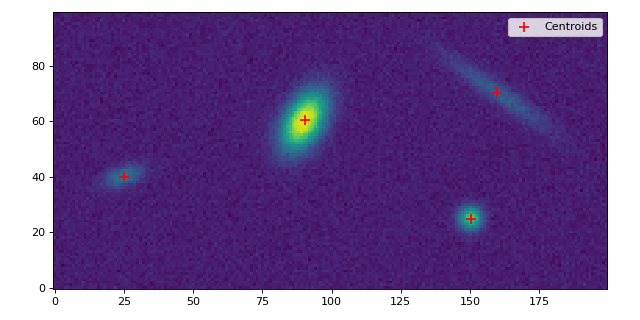
The measured centroids are all very close to the true centroids of the
simulated objects in the image, which have (x, y) values of (25,
40), (90, 60), (150, 25), and (160, 70).
Let’s plot the results:
(Source code, png, hires.png, pdf, svg)
