centroid_sources#
- photutils.centroids.centroid_sources(data, xpos, ypos, box_size=11, footprint=None, mask=None, centroid_func=<function centroid_com>, **kwargs)[source]#
Calculate the centroid of sources at the defined positions in a 2D array using a specified centroid function.
A cutout image centered on each input position will be used to calculate the centroid position. The cutout image is defined either using the
box_sizeorfootprintkeyword. Thefootprintkeyword can be used to create a non-rectangular cutout image.Masks and non-finite values are handled by the input
centroid_func. When using a centroid function provided by Photutils, non-finite values (e.g., NaN or inf) in thedataarray are automatically masked. Thecentroid_1dgandcentroid_2dgfunctions also automatically mask any pixels with non-finiteerrorarray values. The final mask is a logical OR combination of the inputmask, the automatically generated mask(s) for non-finite values, and the mask of the inputdataif it is aMaskedArray. The centroid is calculated using only the unmasked data values.- Parameters:
- data2D array_like
The 2D image data.
datacan be aMaskedArray. The image should be background-subtracted.- xpos, yposfloat or array_like of float
The initial
xandypixel position(s) of the center position. A cutout image centered on this position will be used to calculate the centroid.- box_sizeint or array_like of int, optional
The size of the cutout image along each axis. If
box_sizeis a number, then a square cutout ofbox_sizewill be created. Ifbox_sizehas two elements, they must be in(ny, nx)order.box_sizemust have odd values for both axes. Eitherbox_sizeorfootprintmust be defined. If they are both defined, thenfootprintoverridesbox_size.- footprintbool
ndarray, optional A 2D boolean array where
Truevalues describe the local footprint region to cutout.footprintcan be used to create a non-rectangular cutout image, in which case the inputxposandyposrepresent the center of the minimal bounding box for the inputfootprint.box_size=(n, m)is equivalent tofootprint=np.ones((n, m)). Eitherbox_sizeorfootprintmust be defined. If they are both defined, thenfootprintoverridesbox_size. The samefootprintis used for all sources.- mask2D bool
ndarray, optional A 2D boolean array with the same shape as
data, where aTruevalue indicates the corresponding element ofdatais masked. Ifdatais aMaskedArray, its mask will be combined (using bitwise OR) with the inputmask.- centroid_funccallable, optional
A callable object (e.g., function or class) that is used to calculate the centroid of a 2D array. The
centroid_funcmust accept a 2Dndarray, have amaskkeyword and optionally anerrorkeyword. The callable object must return two scalar values representing the (x, y) centroid. The default iscentroid_com.- **kwargsdict, optional
Any additional keyword arguments accepted by the
centroid_func.
- Returns:
- xcentroid, ycentroid
ndarray The
xandypixel position(s) of the centroids. NaNs will be returned where the centroid failed. This is usually due abox_sizethat is too small when using a fitting-based centroid function (e.g.,centroid_1dg,centroid_2dg, orcentroid_quadratic).
- xcentroid, ycentroid
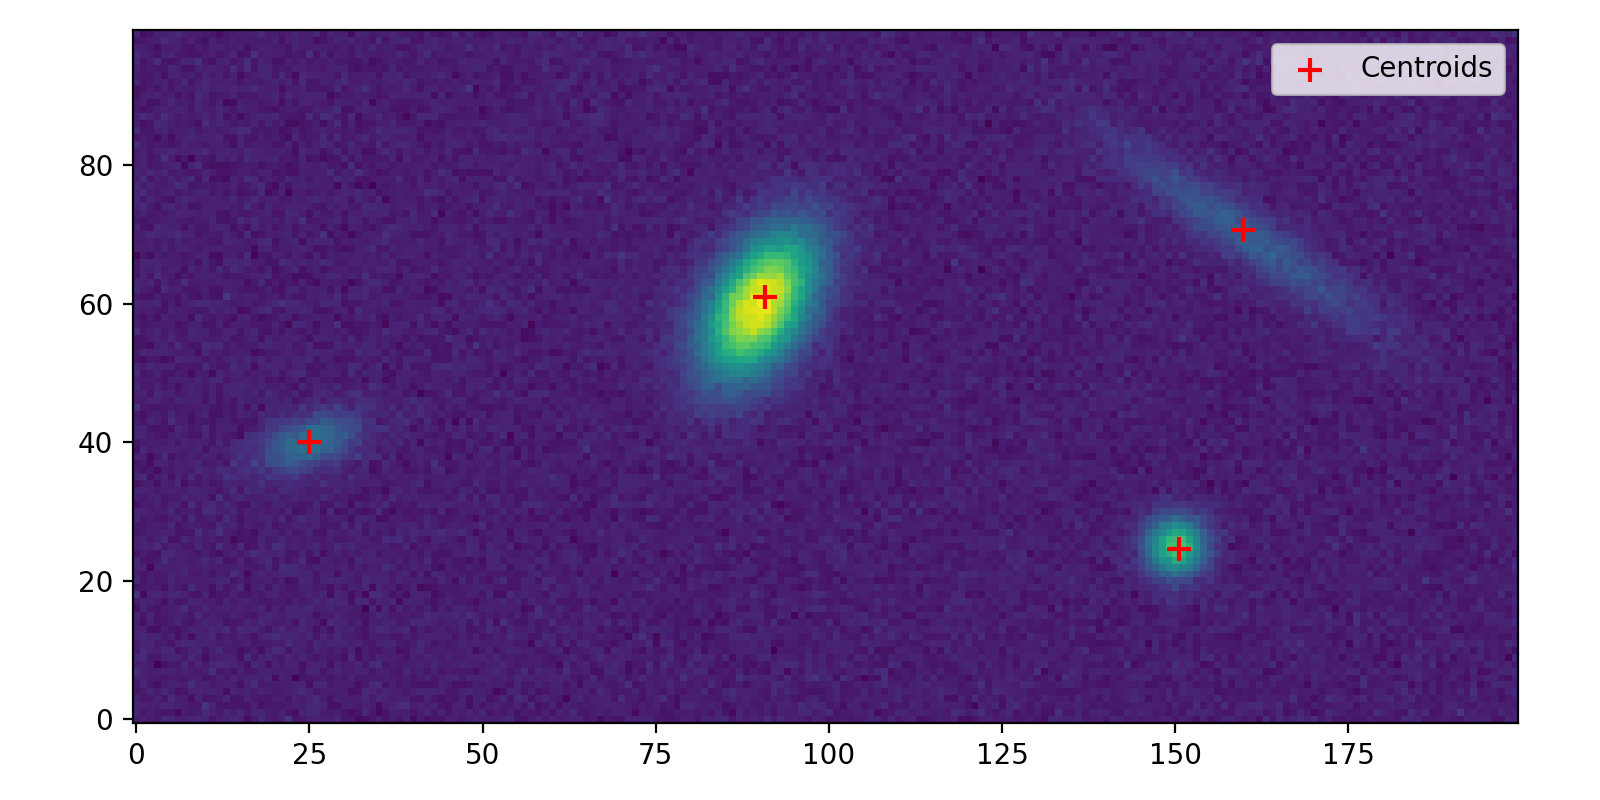
Examples
>>> import numpy as np
>>> from photutils.centroids import centroid_2dg, centroid_sources
>>> from photutils.datasets import make_4gaussians_image
>>> data = make_4gaussians_image()
>>> data -= np.median(data[0:30, 0:125])
>>> x_init = (25, 91, 151, 160)
>>> y_init = (40, 61, 24, 71)
>>> x, y = centroid_sources(data, x_init, y_init, box_size=25,
...                         centroid_func=centroid_2dg)
>>> print(x)
[ 24.96807828  89.98684636 149.96545721 160.18810915]
>>> print(y)
[40.03657613 60.01836631 24.96777946 69.80208702]
(
Source code,png,hires.png,pdf,svg)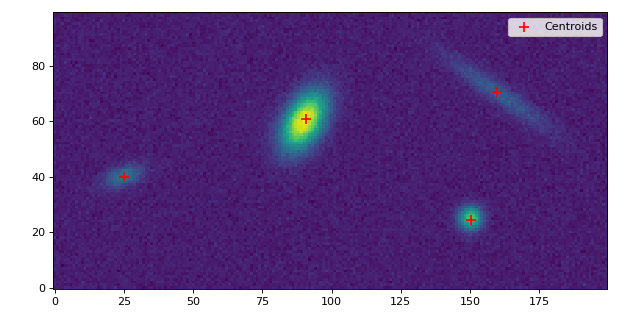