EnsquaredCurveOfGrowth#
- class photutils.profiles.EnsquaredCurveOfGrowth(data, xycen, half_sizes, *, error=None, mask=None, method='exact', subpixels=5)[source]#
Bases:
ProfileBaseClass to create a curve of growth using concentric square apertures.
The ensquared curve of growth profile represents the square aperture flux as a function of the square half-size (half side length).
- Parameters:
- data2D
ndarray The 2D data array. The data should be background-subtracted. Non-finite values (e.g., NaN or inf) in the
dataorerrorarray are automatically masked.- xycentuple of 2 floats
The
(x, y)pixel coordinate of the source center.- half_sizes1D float
ndarray An array of the square half side lengths.
half_sizesmust be strictly increasing with a minimum value greater than zero, and contain at least 2 values. The spacing does not need to be constant. The full side length of each square aperture is2 * half_sizes.- error2D
ndarray, optional The 1-sigma errors of the input
data.erroris assumed to include all sources of error, including the Poisson error of the sources (seecalc_total_error).errormust have the same shape as the inputdata. Non-finite values (e.g., NaN or inf) in thedataorerrorarray are automatically masked.- mask2D bool
ndarray, optional A boolean mask with the same shape as
datawhere aTruevalue indicates the corresponding element ofdatais masked. Masked data are excluded from all calculations.- method{‘exact’, ‘center’, ‘subpixel’}, optional
The method used to determine the pixel weights (the fraction of the pixel area covered by the aperture):
'exact'(default): Calculates the exact geometric overlap area. Weights are continuous in the range [0, 1].'center': Binary weighting based on the pixel center. Weights are either 0 or 1. A pixel is included only if its center lies strictly inside the aperture; pixel centers lying exactly on the aperture boundary are excluded (weight 0).'subpixel': Approximates the overlap by averaging binary samples on a subgrid. The number of samples is set by thesubpixelsparameter. Weights are discrete in the range [0, 1]. A subpixel is included only if its center lies strictly inside the aperture; subpixel centers lying exactly on the aperture boundary are excluded (weight 0).
- subpixelsint, optional
The subsampling factor per axis used when
method='subpixel'. Each pixel is divided into a grid ofsubpixels**2subpixels to approximate the overlap. This parameter is ignored for other methods.
- data2D
See also
Examples
>>> import numpy as np
>>> from astropy.modeling.models import Gaussian2D
>>> from photutils.centroids import centroid_2dg
>>> from photutils.datasets import make_noise_image
>>> from photutils.profiles import EnsquaredCurveOfGrowth
Create an artificial single source. Note that this image does not have any background.
>>> gmodel = Gaussian2D(42.1, 47.8, 52.4, 4.7, 4.7, 0)
>>> yy, xx = np.mgrid[0:100, 0:100]
>>> data = gmodel(xx, yy)
>>> bkg_sig = 2.1
>>> noise = make_noise_image(data.shape, mean=0., stddev=bkg_sig, seed=0)
>>> data += noise
>>> error = np.zeros_like(data) + bkg_sig
Create the ensquared curve of growth.
>>> xycen = centroid_2dg(data)
>>> half_sizes = np.arange(1, 26)
>>> ecog = EnsquaredCurveOfGrowth(data, xycen, half_sizes, error=error)
>>> print(ecog.half_size)
[ 1  2  3  4  5  6  7  8  9 10 11 12 13 14 15 16 17 18 19 20 21 22 23 24
 25]
>>> print(ecog.profile)
[ 171.51682931  640.93965938 1328.92447125 2143.49339746 2954.67817356
 3718.43574763 4357.67409109 4845.38866928 5199.93124392 5481.4874771
 5641.60852855 5752.43870109 5791.01446371 5819.46039533 5832.44691816
 5825.39056549 5834.14890108 5833.42003487 5852.25143102 5856.59671815
 5869.46227464 5872.94734439 5868.92606685 5849.96903786 5839.55875017]
>>> print(ecog.profile_error)
[  4.2   8.4  12.6  16.8  21.   25.2  29.4  33.6  37.8  42.   46.2  50.4
  54.6  58.8  63.   67.2  71.4  75.6  79.8  84.   88.2  92.4  96.6 100.8
 105. ]
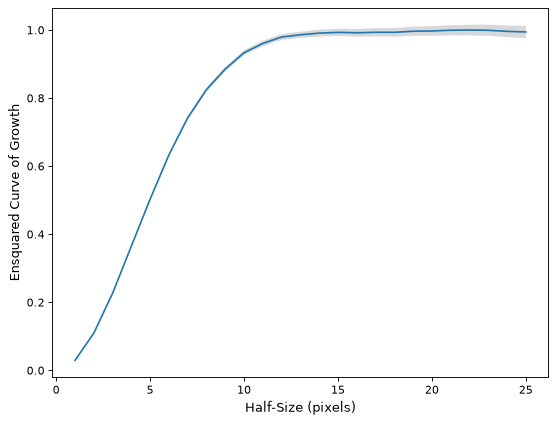
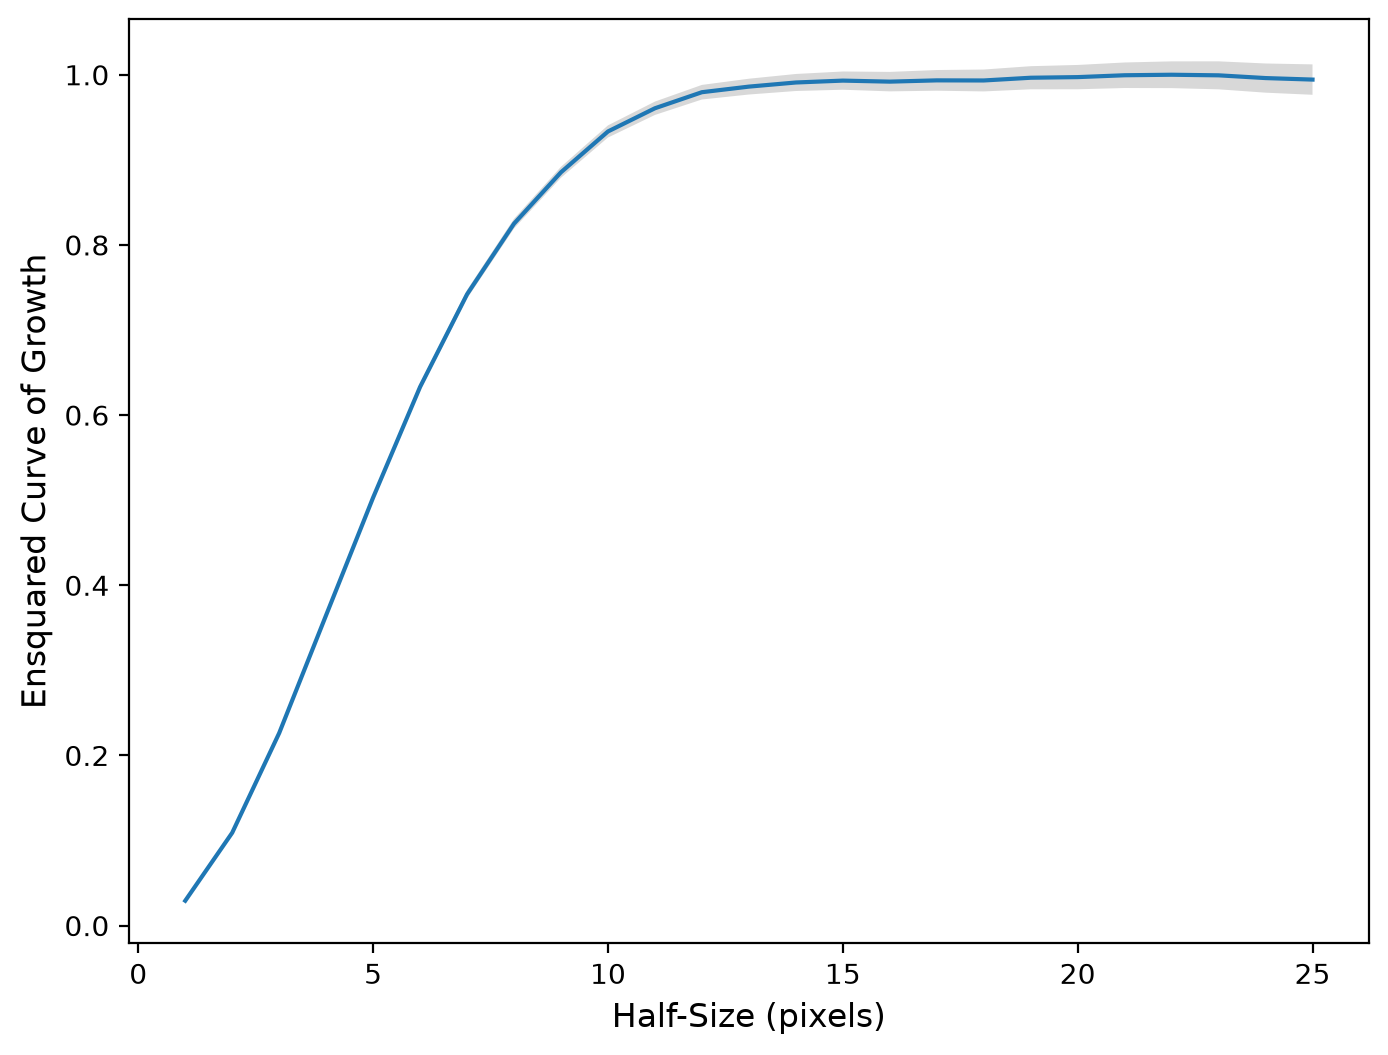
Normalize the profile and plot the normalized ensquared curve of growth.
(
Source code,png,hires.png,pdf,svg)
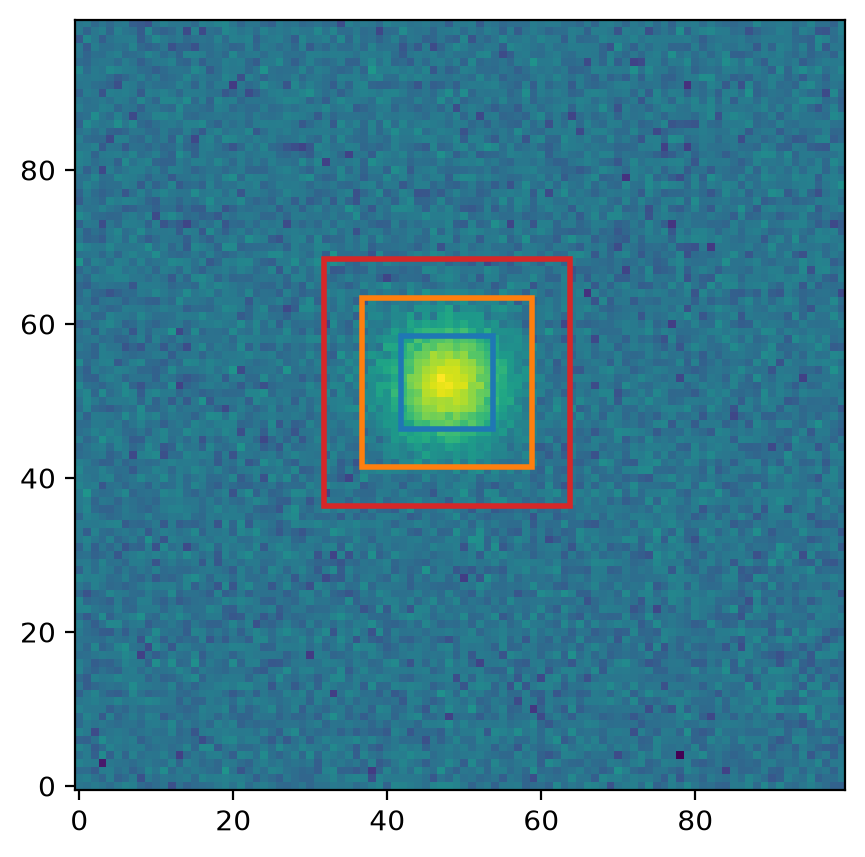
Plot a couple of the apertures on the data.
(
Source code,png,hires.png,pdf,svg)
Attributes Summary
A list of
RectangularApertureobjects used to measure the profile.The unmasked area in each square aperture as a function of size as a 1D
ndarray.The profile half-sizes (half side lengths) in pixels as a 1D
ndarray.The ensquared curve-of-growth profile as a 1D
ndarray.The ensquared curve-of-growth profile errors as a 1D
ndarray.The profile half-sizes (half side lengths) in pixels as a 1D
ndarray.Methods Summary
calc_ee_at_half_size(half_size)Calculate the ensquared energy at a given half-size using a cubic interpolator based on the profile data.
Calculate the half-size at a given ensquared energy using a cubic interpolator based on the profile data.
normalize([method])Normalize the profile.
plot([ax])Plot the profile.
plot_error([ax])Plot the profile errors.
Unnormalize the profile back to the original state before any calls to
normalize.Attributes Documentation
- apertures#
A list of
RectangularApertureobjects used to measure the profile.
- half_size#
The profile half-sizes (half side lengths) in pixels as a 1D
ndarray.This is the same as the input
half_sizes.Note that these are the half side lengths of the square apertures used to measure the profile. The full side length of each square aperture is
2 * half_size. They can be used directly to measure the ensquared energy/flux at a given half-size.
- profile_error#
The ensquared curve-of-growth profile errors as a 1D
ndarray.If no
errorarray was provided, an empty array with shape(0,)is returned.
- radius#
The profile half-sizes (half side lengths) in pixels as a 1D
ndarray.This is an alias for
half_size.
Methods Documentation
- calc_ee_at_half_size(half_size)[source]#
Calculate the ensquared energy at a given half-size using a cubic interpolator based on the profile data.
Note that this method assumes that input data has been normalized such that the total enclosed flux is 1 for an infinitely large half-size. You can also use the
normalizemethod before calling this method to normalize the profile to be 1 at the largest inputhalf_sizes.
- calc_half_size_at_ee(ee)[source]#
Calculate the half-size at a given ensquared energy using a cubic interpolator based on the profile data.
Note that this method assumes that input data has been normalized such that the total enclosed flux is 1 for an infinitely large half-size. You can also use the
normalizemethod before calling this method to normalize the profile to be 1 at the largest inputhalf_sizes.This interpolator returns values only for regions where the ensquared curve-of-growth profile is monotonically increasing.
- normalize(method='max')#
Normalize the profile.
- Parameters:
- method{‘max’, ‘sum’}, optional
The method used to normalize the profile:
'max'(default): The profile is normalized such that its maximum value is 1.'sum': The profile is normalized such that its sum (integral) is 1.
- plot(ax=None, **kwargs)#
Plot the profile.
- Parameters:
- ax
matplotlib.axes.AxesorNone, optional The matplotlib axes on which to plot. If
None, then the currentAxesinstance is used.- **kwargsdict, optional
Any keyword arguments accepted by
matplotlib.pyplot.plot.
- ax
- Returns:
- lineslist of
Line2D A list of lines representing the plotted data.
- lineslist of
- plot_error(ax=None, **kwargs)#
Plot the profile errors.
- Parameters:
- ax
matplotlib.axes.AxesorNone, optional The matplotlib axes on which to plot. If
None, then the currentAxesinstance is used.- **kwargsdict, optional
Any keyword arguments accepted by
matplotlib.pyplot.fill_between.
- ax
- Returns:
- poly
matplotlib.collections.PolyCollectionorNone A
PolyCollectioncontaining the plotted polygons, orNoneif no errors were input.
- poly