EllipticalCurveOfGrowth#
- class photutils.profiles.EllipticalCurveOfGrowth(data, xycen, radii, axis_ratio, *, theta=0.0, error=None, mask=None, method='exact', subpixels=5)[source]#
Bases:
ProfileBaseClass to create a curve of growth using concentric elliptical apertures with a fixed axis ratio and orientation.
The elliptical curve of growth profile represents the elliptical aperture flux as a function of the semimajor axis length.
- Parameters:
- data2D
ndarray The 2D data array. The data should be background-subtracted. Non-finite values (e.g., NaN or inf) in the
dataorerrorarray are automatically masked.- xycentuple of 2 floats
The
(x, y)pixel coordinate of the source center.- radii1D float
ndarray An array of the ellipse semimajor-axis lengths.
radiimust be strictly increasing with a minimum value greater than zero, and contain at least 2 values. The spacing does not need to be constant.- axis_ratiofloat
The ratio of the semiminor axis to the semimajor axis (
b / a). Must be in the range0 < axis_ratio <= 1.- thetafloat or
Quantity, optional The rotation angle as an angular quantity (
QuantityorAngle) or value in radians (as a float) from the positivexaxis. The rotation angle increases counterclockwise.- error2D
ndarray, optional The 1-sigma errors of the input
data.erroris assumed to include all sources of error, including the Poisson error of the sources (seecalc_total_error).errormust have the same shape as the inputdata. Non-finite values (e.g., NaN or inf) in thedataorerrorarray are automatically masked.- mask2D bool
ndarray, optional A boolean mask with the same shape as
datawhere aTruevalue indicates the corresponding element ofdatais masked. Masked data are excluded from all calculations.- method{‘exact’, ‘center’, ‘subpixel’}, optional
The method used to determine the pixel weights (the fraction of the pixel area covered by the aperture):
'exact'(default): Calculates the exact geometric overlap area. Weights are continuous in the range [0, 1].'center': Binary weighting based on the pixel center. Weights are either 0 or 1. A pixel is included only if its center lies strictly inside the aperture; pixel centers lying exactly on the aperture boundary are excluded (weight 0).'subpixel': Approximates the overlap by averaging binary samples on a subgrid. The number of samples is set by thesubpixelsparameter. Weights are discrete in the range [0, 1]. A subpixel is included only if its center lies strictly inside the aperture; subpixel centers lying exactly on the aperture boundary are excluded (weight 0).
- subpixelsint, optional
The subsampling factor per axis used when
method='subpixel'. Each pixel is divided into a grid ofsubpixels**2subpixels to approximate the overlap. This parameter is ignored for other methods.
- data2D
See also
Examples
>>> import numpy as np
>>> from astropy.modeling.models import Gaussian2D
>>> from photutils.centroids import centroid_2dg
>>> from photutils.datasets import make_noise_image
>>> from photutils.profiles import EllipticalCurveOfGrowth
Create an artificial elliptical source. Note that this image does not have any background.
>>> gmodel = Gaussian2D(42.1, 47.8, 52.4, 9.4, 4.7, np.deg2rad(42))
>>> yy, xx = np.mgrid[0:100, 0:100]
>>> data = gmodel(xx, yy)
>>> bkg_sig = 2.1
>>> noise = make_noise_image(data.shape, mean=0., stddev=bkg_sig, seed=0)
>>> data += noise
>>> error = np.zeros_like(data) + bkg_sig
Create the elliptical curve of growth with an axis ratio of 0.5 and a rotation angle of 42 degrees.
>>> xycen = centroid_2dg(data)
>>> radii = np.arange(1, 40)
>>> ecog = EllipticalCurveOfGrowth(data, xycen, radii, axis_ratio=0.5,
...                                theta=np.deg2rad(42), error=error)
>>> print(ecog.radius)
[ 1  2  3  4  5  6  7  8  9 10 11 12 13 14 15 16 17 18 19 20 21 22 23 24
 25 26 27 28 29 30 31 32 33 34 35 36 37 38 39]
>>> print(ecog.profile)
[   67.39762867   267.711181     588.47524874  1021.31994307
  1546.53867489  2152.12698084  2824.97954482  3541.64650208
  4284.363828    5040.93586551  5777.06397177  6488.33779084
  7179.10371288  7826.17773764  8418.08027957  8948.7310004
  9418.56480323  9810.0373925  10163.11467352 10477.42357537
 10731.89184641 10920.11723061 11092.34059512 11235.12552706
 11347.43721424 11454.03577845 11520.64656354 11555.89668261
 11571.27935302 11583.89774142 11605.79810845 11639.93073462
 11648.27293403 11660.34772581 11662.89065496 11643.07787619
 11630.36674411 11636.61537567 11636.60448497]
>>> print(ecog.profile_error)
[  2.63195969   5.26391938   7.89587907  10.52783875  13.15979844
  15.79175813  18.42371782  21.05567751  23.6876372   26.31959688
  28.95155657  31.58351626  34.21547595  36.84743564  39.47939533
  42.11135501  44.7433147   47.37527439  50.00723408  52.63919377
  55.27115346  57.90311314  60.53507283  63.16703252  65.79899221
  68.4309519   71.06291159  73.69487127  76.32683096  78.95879065
  81.59075034  84.22271003  86.85466972  89.4866294   92.11858909
  94.75054878  97.38250847 100.01446816 102.64642785]
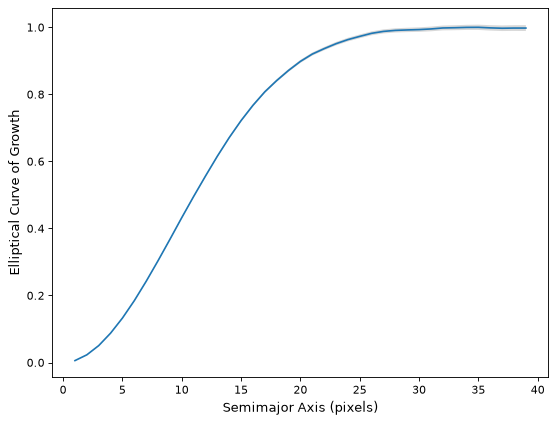
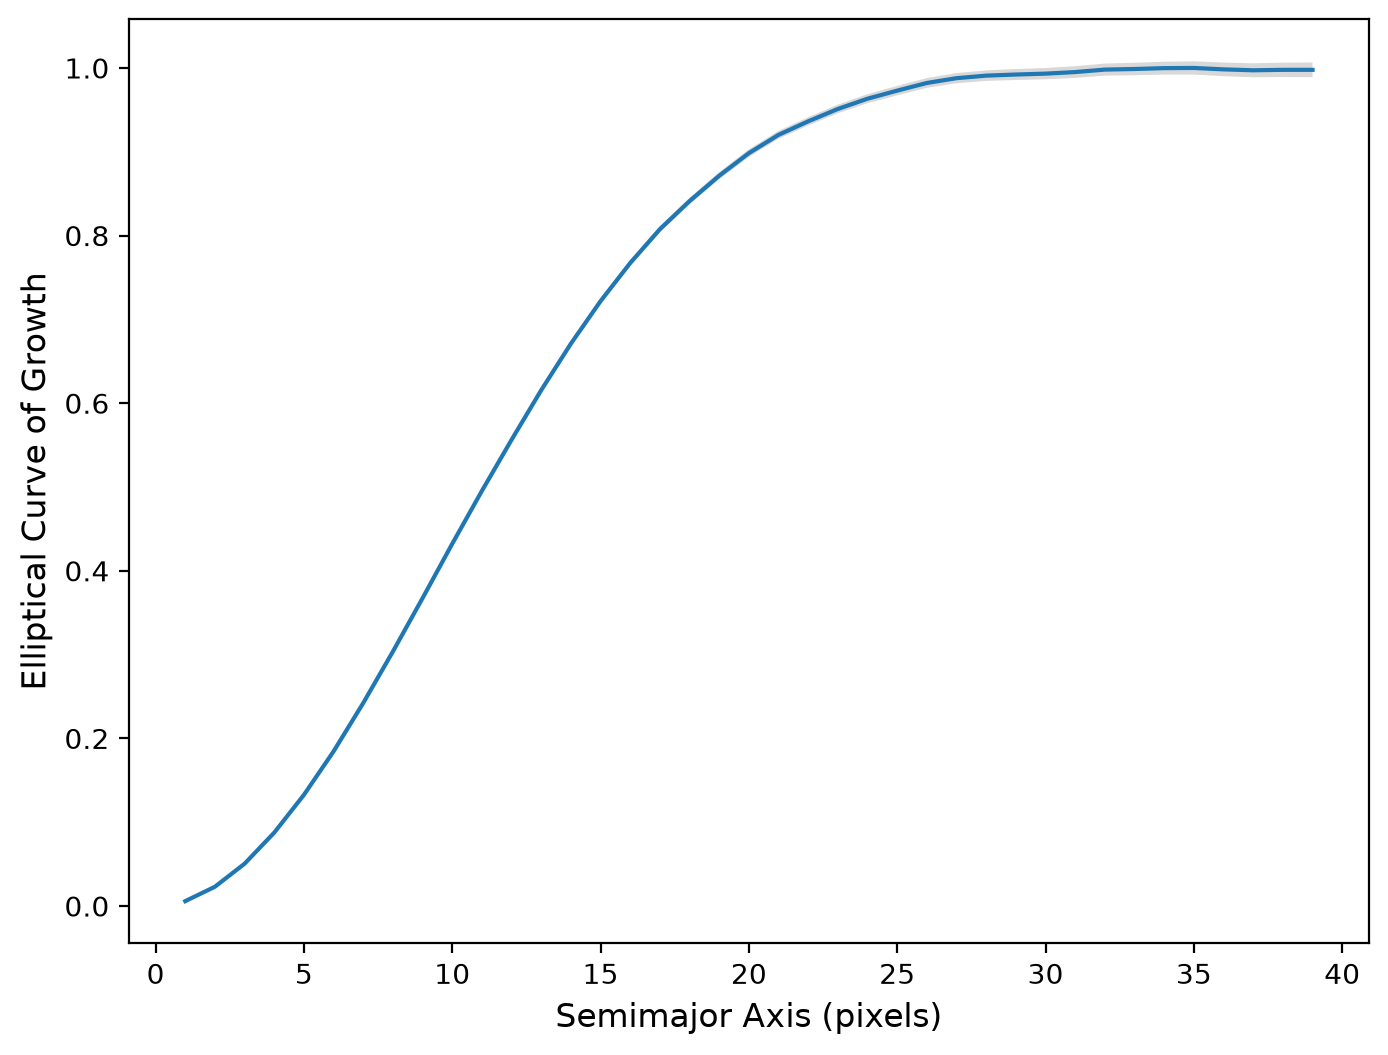
Normalize the profile and plot the normalized elliptical curve of growth.
(
Source code,png,hires.png,pdf,svg)
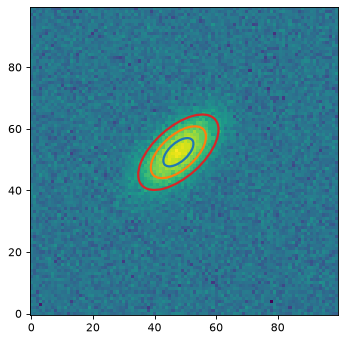
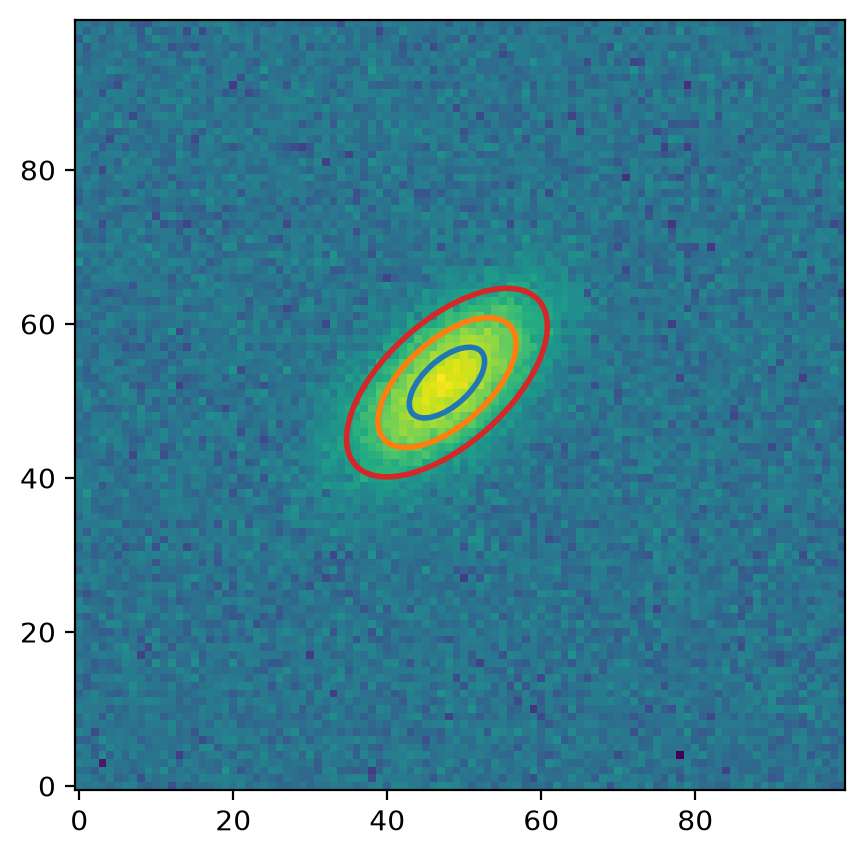
Plot a couple of the apertures on the data.
(
Source code,png,hires.png,pdf,svg)
Attributes Summary
A list of
EllipticalApertureobjects used to measure the profile.The unmasked area in each elliptical aperture as a function of semimajor axis as a 1D
ndarray.The elliptical curve-of-growth profile as a 1D
ndarray.The elliptical curve-of-growth profile errors as a 1D
ndarray.The profile semimajor-axis lengths in pixels as a 1D
ndarray.Methods Summary
calc_ee_at_radius(radius)Calculate the encircled energy at a given semimajor-axis length using a cubic interpolator based on the profile data.
Calculate the semimajor-axis length at a given encircled energy using a cubic interpolator based on the profile data.
normalize([method])Normalize the profile.
plot([ax])Plot the profile.
plot_error([ax])Plot the profile errors.
Unnormalize the profile back to the original state before any calls to
normalize.Attributes Documentation
- apertures#
A list of
EllipticalApertureobjects used to measure the profile.
- area#
The unmasked area in each elliptical aperture as a function of semimajor axis as a 1D
ndarray.
- profile_error#
The elliptical curve-of-growth profile errors as a 1D
ndarray.If no
errorarray was provided, an empty array with shape(0,)is returned.
- radius#
The profile semimajor-axis lengths in pixels as a 1D
ndarray.This is the same as the input
radii.Note that these are the semimajor-axis lengths of the elliptical apertures used to measure the profile. Thus, they are the semimajor-axis values that enclose the given flux.
Methods Documentation
- calc_ee_at_radius(radius)[source]#
Calculate the encircled energy at a given semimajor-axis length using a cubic interpolator based on the profile data.
Note that this method assumes that input data has been normalized such that the total enclosed flux is 1 for an infinitely large radius. You can also use the
normalizemethod before calling this method to normalize the profile to be 1 at the largest inputradii.
- calc_radius_at_ee(ee)[source]#
Calculate the semimajor-axis length at a given encircled energy using a cubic interpolator based on the profile data.
Note that this method assumes that input data has been normalized such that the total enclosed flux is 1 for an infinitely large radius. You can also use the
normalizemethod before calling this method to normalize the profile to be 1 at the largest inputradii.This interpolator returns values only for regions where the elliptical curve-of-growth profile is monotonically increasing.
- normalize(method='max')#
Normalize the profile.
- Parameters:
- method{‘max’, ‘sum’}, optional
The method used to normalize the profile:
'max'(default): The profile is normalized such that its maximum value is 1.'sum': The profile is normalized such that its sum (integral) is 1.
- plot(ax=None, **kwargs)#
Plot the profile.
- Parameters:
- ax
matplotlib.axes.AxesorNone, optional The matplotlib axes on which to plot. If
None, then the currentAxesinstance is used.- **kwargsdict, optional
Any keyword arguments accepted by
matplotlib.pyplot.plot.
- ax
- Returns:
- lineslist of
Line2D A list of lines representing the plotted data.
- lineslist of
- plot_error(ax=None, **kwargs)#
Plot the profile errors.
- Parameters:
- ax
matplotlib.axes.AxesorNone, optional The matplotlib axes on which to plot. If
None, then the currentAxesinstance is used.- **kwargsdict, optional
Any keyword arguments accepted by
matplotlib.pyplot.fill_between.
- ax
- Returns:
- poly
matplotlib.collections.PolyCollectionorNone A
PolyCollectioncontaining the plotted polygons, orNoneif no errors were input.
- poly