RadialProfile
- class photutils.profiles.RadialProfile(data, xycen, radii, *, error=None, mask=None, method='exact', subpixels=5)[source]
Bases:
ProfileBaseClass to create a radial profile using concentric circular apertures.
The radial profile represents the azimuthally-averaged flux in circular annuli apertures as a function of radius.
For this class, the input radii represent the edges of the radial bins. This differs from the
RadialProfileclass, where the inputs represent the centers of the radial bins.- Parameters:
- data2D
numpy.ndarray The 2D data array. The data should be background-subtracted. Non-finite values (e.g., NaN or inf) in the
dataorerrorarray are automatically masked.- xycentuple of 2 floats
The
(x, y)pixel coordinate of the source center.- edge_radii1D float
numpy.ndarray An array of radii defining the edges of the radial bins.
edge_radiimust be strictly increasing with a minimum value greater than or equal to zero, and contain at least 2 values. The radial spacing does not need to be constant. The outputradiusattribute will be defined at the bin centers.- error2D
numpy.ndarray, optional The 1-sigma errors of the input
data.erroris assumed to include all sources of error, including the Poisson error of the sources (seecalc_total_error) .errormust have the same shape as the inputdata. Non-finite values (e.g., NaN or inf) in thedataorerrorarray are automatically masked.- mask2D bool
numpy.ndarray, optional A boolean mask with the same shape as
datawhere aTruevalue indicates the corresponding element ofdatais masked. Masked data are excluded from all calculations.- method{‘exact’, ‘center’, ‘subpixel’}, optional
The method used to determine the overlap of the aperture on the pixel grid:
'exact'(default): The the exact fractional overlap of the aperture and each pixel is calculated. The aperture weights will contain values between 0 and 1.'center': A pixel is considered to be entirely in or out of the aperture depending on whether its center is in or out of the aperture. The aperture weights will contain values only of 0 (out) and 1 (in).'subpixel': A pixel is divided into subpixels (see thesubpixelskeyword), each of which are considered to be entirely in or out of the aperture depending on whether its center is in or out of the aperture. Ifsubpixels=1, this method is equivalent to'center'. The aperture weights will contain values between 0 and 1.
- subpixelsint, optional
For the
'subpixel'method, resample pixels by this factor in each dimension. That is, each pixel is divided intosubpixels**2subpixels. This keyword is ignored unlessmethod='subpixel'.
- data2D
See also
Notes
If the minimum of
edge_radiiis zero, then a circular aperture with radius equal toedge_radii[1]will be used for the innermost aperture.Examples
>>> import numpy as np
>>> from astropy.modeling.models import Gaussian2D
>>> from astropy.visualization import simple_norm
>>> from photutils.centroids import centroid_quadratic
>>> from photutils.datasets import make_noise_image
>>> from photutils.profiles import RadialProfile
Create an artificial single source. Note that this image does not have any background.
>>> gmodel = Gaussian2D(42.1, 47.8, 52.4, 4.7, 4.7, 0)
>>> yy, xx = np.mgrid[0:100, 0:100]
>>> data = gmodel(xx, yy)
>>> error = make_noise_image(data.shape, mean=0., stddev=2.4, seed=123)
>>> data += error
Create the radial profile.
>>> xycen = centroid_quadratic(data, xpeak=48, ypeak=52)
>>> edge_radii = np.arange(26)
>>> rp = RadialProfile(data, xycen, edge_radii, error=error, mask=None)
>>> print(rp.radius)
[ 0.5  1.5  2.5  3.5  4.5  5.5  6.5  7.5  8.5  9.5 10.5 11.5 12.5 13.5
 14.5 15.5 16.5 17.5 18.5 19.5 20.5 21.5 22.5 23.5 24.5]
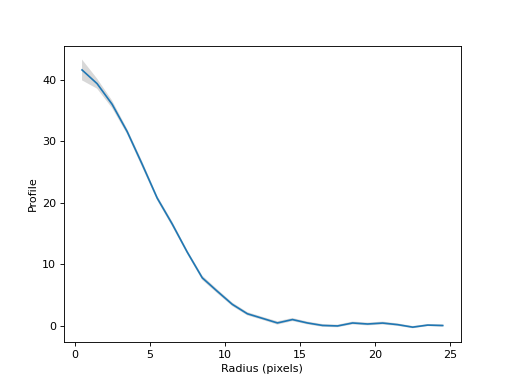
>>> print(rp.profile)
[ 4.15632243e+01  3.93402079e+01  3.59845746e+01  3.15540506e+01
  2.62300757e+01  2.07297033e+01  1.65106801e+01  1.19376723e+01
  7.75743772e+00  5.56759777e+00  3.44112671e+00  1.91350281e+00
  1.17092981e+00  4.22261078e-01  9.70256904e-01  4.16355795e-01
  1.52328707e-02 -6.69985111e-02  4.15522650e-01  2.48494731e-01
  4.03348112e-01  1.43482678e-01 -2.62777461e-01  7.30653622e-02
  7.84616804e-04]
>>> print(rp.profile_error)
[1.69588246 0.81797694 0.61132694 0.44670831 0.49499835 0.38025361
 0.40844702 0.32906672 0.36466713 0.33059274 0.29661894 0.27314739
 0.25551933 0.27675376 0.25553986 0.23421017 0.22966813 0.21747036
 0.23654884 0.22760386 0.23941711 0.20661313 0.18999134 0.17469024
 0.19527558]
Plot the radial profile.
(
Source code,png,hires.png,pdf,svg)
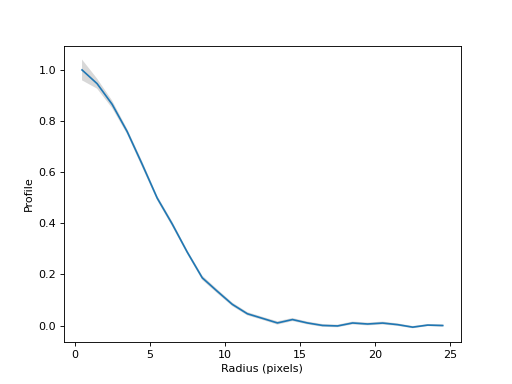
Normalize the profile and plot the normalized radial profile.
(
Source code,png,hires.png,pdf,svg)
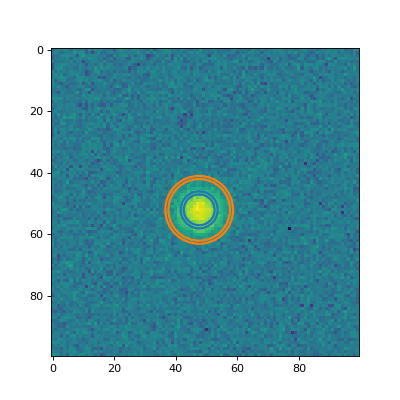
Plot two of the annulus apertures on the data.
(
Source code,png,hires.png,pdf,svg)
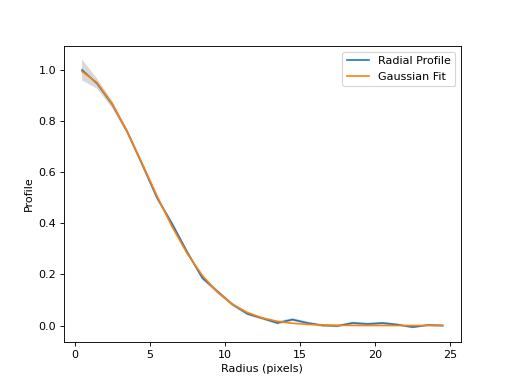
Fit a 1D Gaussian to the radial profile and return the Gaussian model.
>>> rp.gaussian_fit
<Gaussian1D(amplitude=41.54880743, mean=0., stddev=4.71059406)>
>>> print(rp.gaussian_fwhm)
11.09260130738712
Plot the fitted 1D Gaussian on the radial profile.
(
Source code,png,hires.png,pdf,svg)
Attributes Summary
A list of the circular annulus apertures used to measure the radial profile.
The unmasked area in each circular annulus (or aperture) as a function of radius as a 1D
ndarray.The fitted 1D Gaussian to the radial profile as a
Gaussian1Dmodel.The full-width at half-maximum (FWHM) in pixels of the 1D Gaussian fitted to the radial profile.
The fitted 1D Gaussian profile to the radial profile as a 1D
ndarray.The radial profile as a 1D
ndarray.The radial profile errors as a 1D
ndarray.The profile radius (bin centers) in pixels as a 1D
ndarray.Methods Summary
normalize([method])Normalize the profile.
plot([ax])Plot the profile.
plot_error([ax])Plot the profile errors.
Attributes Documentation
- apertures
A list of the circular annulus apertures used to measure the radial profile.
If the
min_radiusis less than or equal to half theradius_step, then a circular aperture with radius equal tomin_radius + 0.5 * radius_stepwill be used for the innermost aperture.
- area
The unmasked area in each circular annulus (or aperture) as a function of radius as a 1D
ndarray.
- gaussian_fit
The fitted 1D Gaussian to the radial profile as a
Gaussian1Dmodel.
- gaussian_fwhm
The full-width at half-maximum (FWHM) in pixels of the 1D Gaussian fitted to the radial profile.
- radius
The profile radius (bin centers) in pixels as a 1D
ndarray.The returned radius values are defined as the arithmetic means of the input radial-bins edges (
radii).For logarithmically-spaced input
radii, one could instead use a radius array defined using the geometric mean of the bin edges, i.e.np.sqrt(radii[:-1] * radii[1:]).
Methods Documentation
- normalize(method='max')
Normalize the profile.
- Parameters:
- method{‘max’, ‘sum’}, optional
The method used to normalize the profile:
‘max’ (default): The profile is normalized such that its peak value is 1.
‘sum’: The profile is normalized such that its sum (integral) is 1.
- plot(ax=None, **kwargs)
Plot the profile.
- Parameters:
- ax
matplotlib.axes.AxesorNone, optional The matplotlib axes on which to plot. If
None, then the currentAxesinstance is used.- **kwargs
dict Any keyword arguments accepted by
matplotlib.pyplot.plot.
- ax
- Returns:
- lineslist of
Line2D A list of lines representing the plotted data.
- lineslist of
- plot_error(ax=None, **kwargs)
Plot the profile errors.
- Parameters:
- ax
matplotlib.axes.AxesorNone, optional The matplotlib axes on which to plot. If
None, then the currentAxesinstance is used.- **kwargs
dict Any keyword arguments accepted by
matplotlib.pyplot.fill_between.
- ax
- Returns:
- lines
matplotlib.collections.PolyCollection A
PolyCollectioncontaining the plotted polygons.
- lines