EnsquaredCurveOfGrowth#
- class photutils.profiles.EnsquaredCurveOfGrowth(data, xycen, half_sizes, *, error=None, mask=None, method='exact', subpixels=5)[source]#
Bases:
ProfileBaseClass to create a curve of growth using concentric square apertures.
The ensquared curve of growth profile represents the square aperture flux as a function of the square half-size (half side length).
- Parameters:
- data2D
ndarray The 2D data array. The data should be background-subtracted. Non-finite values (e.g., NaN or inf) in the
dataorerrorarray are automatically masked.- xycentuple of 2 floats
The
(x, y)pixel coordinate of the source center.- half_sizes1D float
ndarray An array of the square half side lengths.
half_sizesmust be strictly increasing with a minimum value greater than zero, and contain at least 2 values. The spacing does not need to be constant. The full side length of each square aperture is2 * half_sizes.- error2D
ndarray, optional The 1-sigma errors of the input
data.erroris assumed to include all sources of error, including the Poisson error of the sources (seecalc_total_error).errormust have the same shape as the inputdata. Non-finite values (e.g., NaN or inf) in thedataorerrorarray are automatically masked.- mask2D bool
ndarray, optional A boolean mask with the same shape as
datawhere aTruevalue indicates the corresponding element ofdatais masked. Masked data are excluded from all calculations.- method{‘exact’, ‘center’, ‘subpixel’}, optional
The method used to determine the overlap of the aperture on the pixel grid:
'exact'(default): The exact fractional overlap of the aperture and each pixel is calculated. The aperture weights will contain values between 0 and 1.'center': A pixel is considered to be entirely in or out of the aperture depending on whether its center is in or out of the aperture. The aperture weights will contain values only of 0 (out) and 1 (in).'subpixel': A pixel is divided into subpixels (see thesubpixelskeyword), each of which are considered to be entirely in or out of the aperture depending on whether its center is in or out of the aperture. Ifsubpixels=1, this method is equivalent to'center'. The aperture weights will contain values between 0 and 1.
- subpixelsint, optional
For the
'subpixel'method, resample pixels by this factor in each dimension. That is, each pixel is divided intosubpixels**2subpixels. This keyword is ignored unlessmethod='subpixel'.
- data2D
See also
Examples
>>> import numpy as np
>>> from astropy.modeling.models import Gaussian2D
>>> from photutils.centroids import centroid_2dg
>>> from photutils.datasets import make_noise_image
>>> from photutils.profiles import EnsquaredCurveOfGrowth
Create an artificial single source. Note that this image does not have any background.
>>> gmodel = Gaussian2D(42.1, 47.8, 52.4, 4.7, 4.7, 0)
>>> yy, xx = np.mgrid[0:100, 0:100]
>>> data = gmodel(xx, yy)
>>> bkg_sig = 2.1
>>> noise = make_noise_image(data.shape, mean=0., stddev=bkg_sig, seed=0)
>>> data += noise
>>> error = np.zeros_like(data) + bkg_sig
Create the ensquared curve of growth.
>>> xycen = centroid_2dg(data)
>>> half_sizes = np.arange(1, 26)
>>> ecog = EnsquaredCurveOfGrowth(data, xycen, half_sizes, error=error)
>>> print(ecog.half_size)
[ 1  2  3  4  5  6  7  8  9 10 11 12 13 14 15 16 17 18 19 20 21 22 23 24
 25]
>>> print(ecog.profile)
[ 171.35182895  640.63717997 1328.55725483 2142.84258293 2954.12152275
 3717.5208724  4356.82277842 4844.97997426 5199.74452363 5480.78438494
 5641.63617089 5751.92491894 5790.90751883 5819.30778391 5832.38652883
 5825.14679788 5833.55196333 5833.54737611 5851.79194687 5856.58494602
 5869.76637039 5872.91078217 5868.62195688 5850.11085443 5838.889818  ]
>>> print(ecog.profile_error)
[  4.2   8.4  12.6  16.8  21.   25.2  29.4  33.6  37.8  42.   46.2  50.4
  54.6  58.8  63.   67.2  71.4  75.6  79.8  84.   88.2  92.4  96.6 100.8
 105. ]
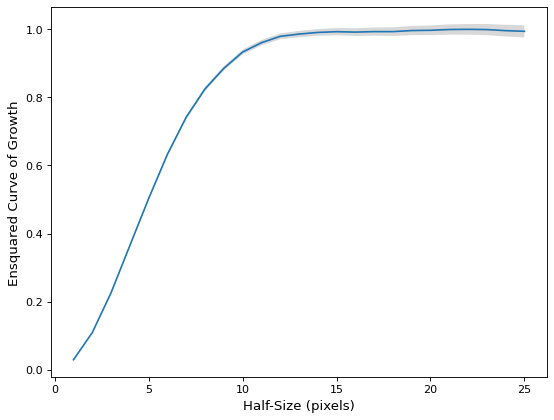
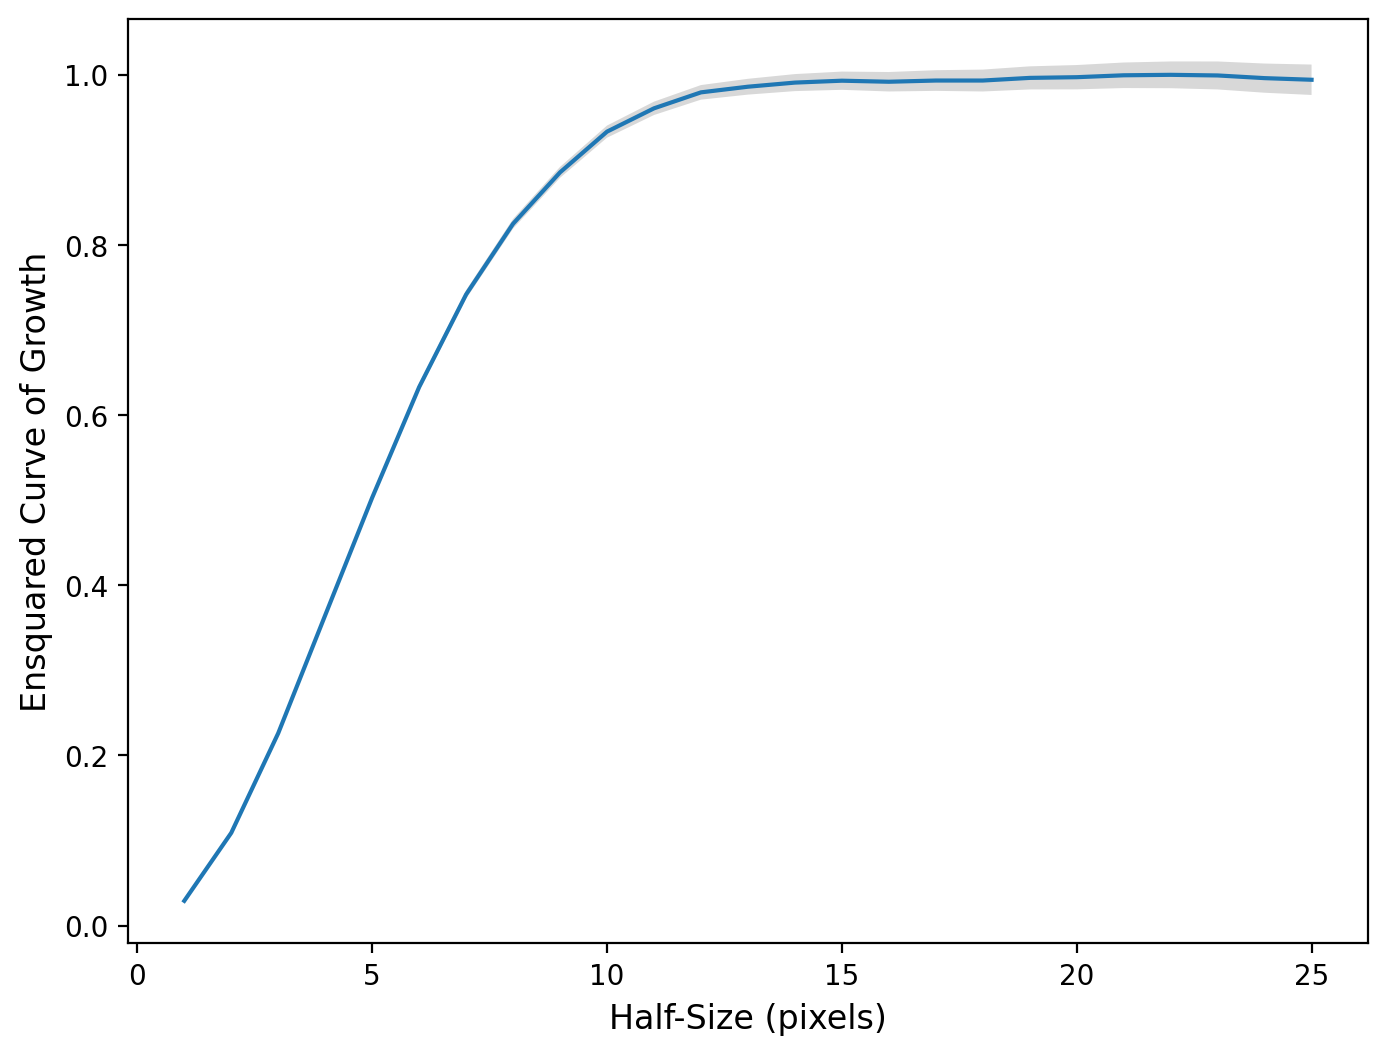
Normalize the profile and plot the normalized ensquared curve of growth.
(
Source code,png,hires.png,pdf,svg)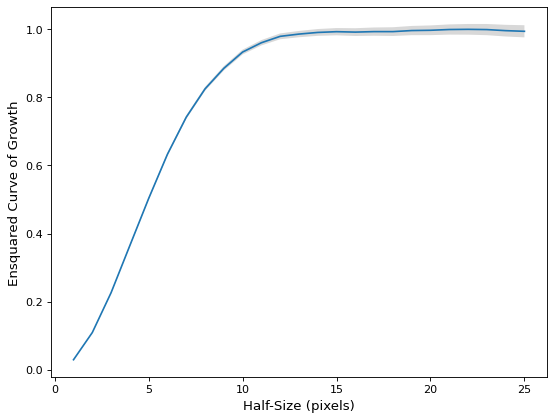
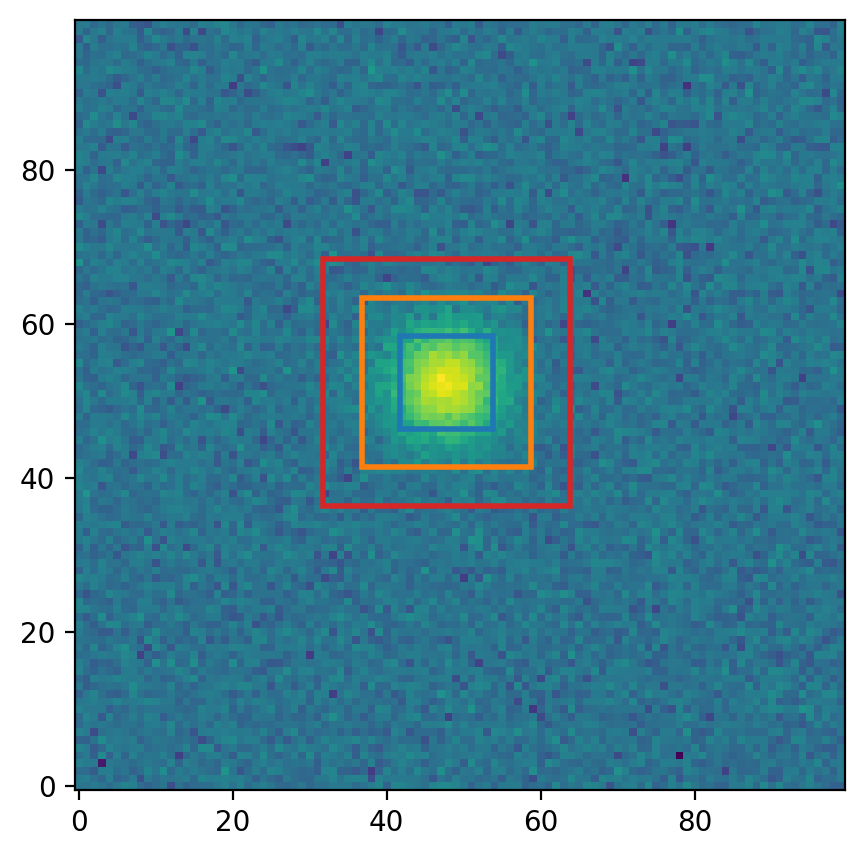
Plot a couple of the apertures on the data.
(
Source code,png,hires.png,pdf,svg)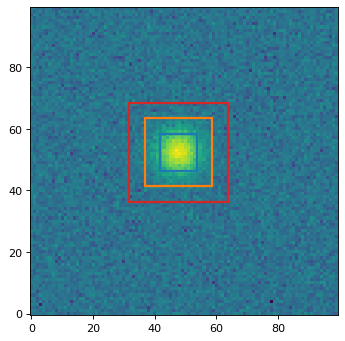
Attributes Summary
A list of
RectangularApertureobjects used to measure the profile.The unmasked area in each square aperture as a function of size as a 1D
ndarray.The profile half-sizes (half side lengths) in pixels as a 1D
ndarray.The ensquared curve-of-growth profile as a 1D
ndarray.The ensquared curve-of-growth profile errors as a 1D
ndarray.The profile half-sizes (half side lengths) in pixels as a 1D
ndarray.Methods Summary
calc_ee_at_half_size(half_size)Calculate the ensquared energy at a given half-size using a cubic interpolator based on the profile data.
Calculate the half-size at a given ensquared energy using a cubic interpolator based on the profile data.
normalize([method])Normalize the profile.
plot([ax])Plot the profile.
plot_error([ax])Plot the profile errors.
Unnormalize the profile back to the original state before any calls to
normalize.Attributes Documentation
- apertures#
A list of
RectangularApertureobjects used to measure the profile.
- half_size#
The profile half-sizes (half side lengths) in pixels as a 1D
ndarray.This is the same as the input
half_sizes.Note that these are the half side lengths of the square apertures used to measure the profile. The full side length of each square aperture is
2 * half_size. They can be used directly to measure the ensquared energy/flux at a given half-size.
- profile_error#
The ensquared curve-of-growth profile errors as a 1D
ndarray.If no
errorarray was provided, an empty array with shape(0,)is returned.
- radius#
The profile half-sizes (half side lengths) in pixels as a 1D
ndarray.This is an alias for
half_size.
Methods Documentation
- calc_ee_at_half_size(half_size)[source]#
Calculate the ensquared energy at a given half-size using a cubic interpolator based on the profile data.
Note that this method assumes that input data has been normalized such that the total enclosed flux is 1 for an infinitely large half-size. You can also use the
normalizemethod before calling this method to normalize the profile to be 1 at the largest inputhalf_sizes.
- calc_half_size_at_ee(ee)[source]#
Calculate the half-size at a given ensquared energy using a cubic interpolator based on the profile data.
Note that this method assumes that input data has been normalized such that the total enclosed flux is 1 for an infinitely large half-size. You can also use the
normalizemethod before calling this method to normalize the profile to be 1 at the largest inputhalf_sizes.This interpolator returns values only for regions where the ensquared curve-of-growth profile is monotonically increasing.
- normalize(method='max')#
Normalize the profile.
- Parameters:
- method{‘max’, ‘sum’}, optional
The method used to normalize the profile:
'max'(default): The profile is normalized such that its maximum value is 1.'sum': The profile is normalized such that its sum (integral) is 1.
- plot(ax=None, **kwargs)#
Plot the profile.
- Parameters:
- ax
matplotlib.axes.AxesorNone, optional The matplotlib axes on which to plot. If
None, then the currentAxesinstance is used.- **kwargsdict, optional
Any keyword arguments accepted by
matplotlib.pyplot.plot.
- ax
- Returns:
- lineslist of
Line2D A list of lines representing the plotted data.
- lineslist of
- plot_error(ax=None, **kwargs)#
Plot the profile errors.
- Parameters:
- ax
matplotlib.axes.AxesorNone, optional The matplotlib axes on which to plot. If
None, then the currentAxesinstance is used.- **kwargsdict, optional
Any keyword arguments accepted by
matplotlib.pyplot.fill_between.
- ax
- Returns:
- poly
matplotlib.collections.PolyCollectionorNone A
PolyCollectioncontaining the plotted polygons, orNoneif no errors were input.
- poly