Source Grouping Algorithms
Introduction
In Point Spread Function (PSF) photometry, a grouping algorithm can be used to combine stars into optimum groups. The stars in each group are usually defined as those close enough together such that they need to be fit simultaneously, i.e., their profiles overlap.
Stetson, in his seminal paper (Stetson 1987, PASP 99, 191), provided a simple and powerful grouping algorithm to decide whether the profile of a given star extends into the fitting region of any other star. The paper defines this in terms of a “critical separation” parameter, which is defined as the minimal distance that any two stars must be separated by in order to be in different groups. The critical separation is generally defined as a multiple of the stellar full width at half maximum (FWHM).
Getting Started
Photutils provides the SourceGrouper
class to group stars. The groups are formed using hierarchical
agglomerative clustering with a distance criterion, calling the
scipy.cluster.hierarchy.fclusterdata function.
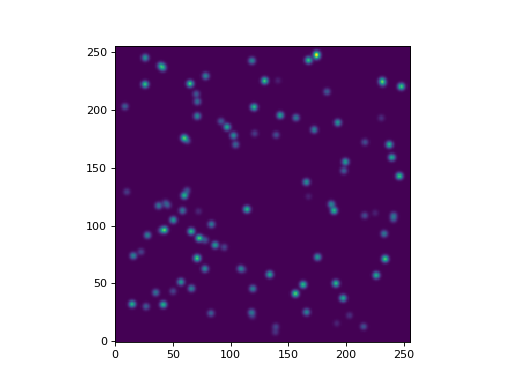
First, let’s make some Gaussian sources using
make_random_gaussians_table and
make_gaussian_sources_image. The former will
return a Table containing parameters for 2D Gaussian
sources and the latter will make an actual image using that table:
>>> from photutils.datasets import (make_gaussian_sources_image,
...                                 make_random_gaussians_table)
>>> n_sources = 100
>>> size = 256
>>> bounds = [6, 250]
>>> sigma_psf = 2.0
>>> params = {'flux': [500, 5000],
...          'x_mean': bounds,
...          'y_mean': bounds,
...          'x_stddev': [sigma_psf, sigma_psf],
...          'y_stddev': [sigma_psf, sigma_psf],
...          'theta': [0, 0]}
>>> stars = make_random_gaussians_table(n_sources, params, seed=123)
>>> shape = (size, size)
>>> data = make_gaussian_sources_image(shape, stars)
stars is an astropy Table of parameters defining
the position and shape of the stars.
Let’s display the image:
>>> import matplotlib.pyplot as plt
>>> plt.imshow(data, origin='lower', interpolation='nearest')
(Source code, png, hires.png, pdf, svg)

Now, let’s find the stellar groups. We start by creating
a SourceGrouper object. Here we set the
min_separation parameter 2.5 * fwhm, where the fwhm is
calculated from the 2D Gaussian standard deviation used to generate
the stars. In general one will need to measure the FWHM of the stellar
profiles.
>>> from astropy.stats import gaussian_sigma_to_fwhm
>>> from photutils.psf import SourceGrouper
>>> fwhm = sigma_psf * gaussian_sigma_to_fwhm
>>> min_separation = 2.5 * fwhm
>>> grouper = SourceGrouper(min_separation)
We then call the class instance on arrays of the star (x, y) positions. Here will use the known positions of the stars when we generated the image. In general, one can use a star finder (Source Detection (photutils.detection)) to find the sources.
>>> import numpy as np
>>> x = np.array(stars['x_mean'])
>>> y = np.array(stars['y_mean'])
>>> groups = grouper(x, y)
The groups output is an array of integers (ordered the same as the
(x, y) inputs) containing the group indices. Stars with the same group
index are in the same group.
For example, to find all the stars in group 3:
>>> mask = groups == 3
>>> x[mask], y[mask]
(array([215.49777086, 224.48346981]), array([108.91763388, 111.12429701]))
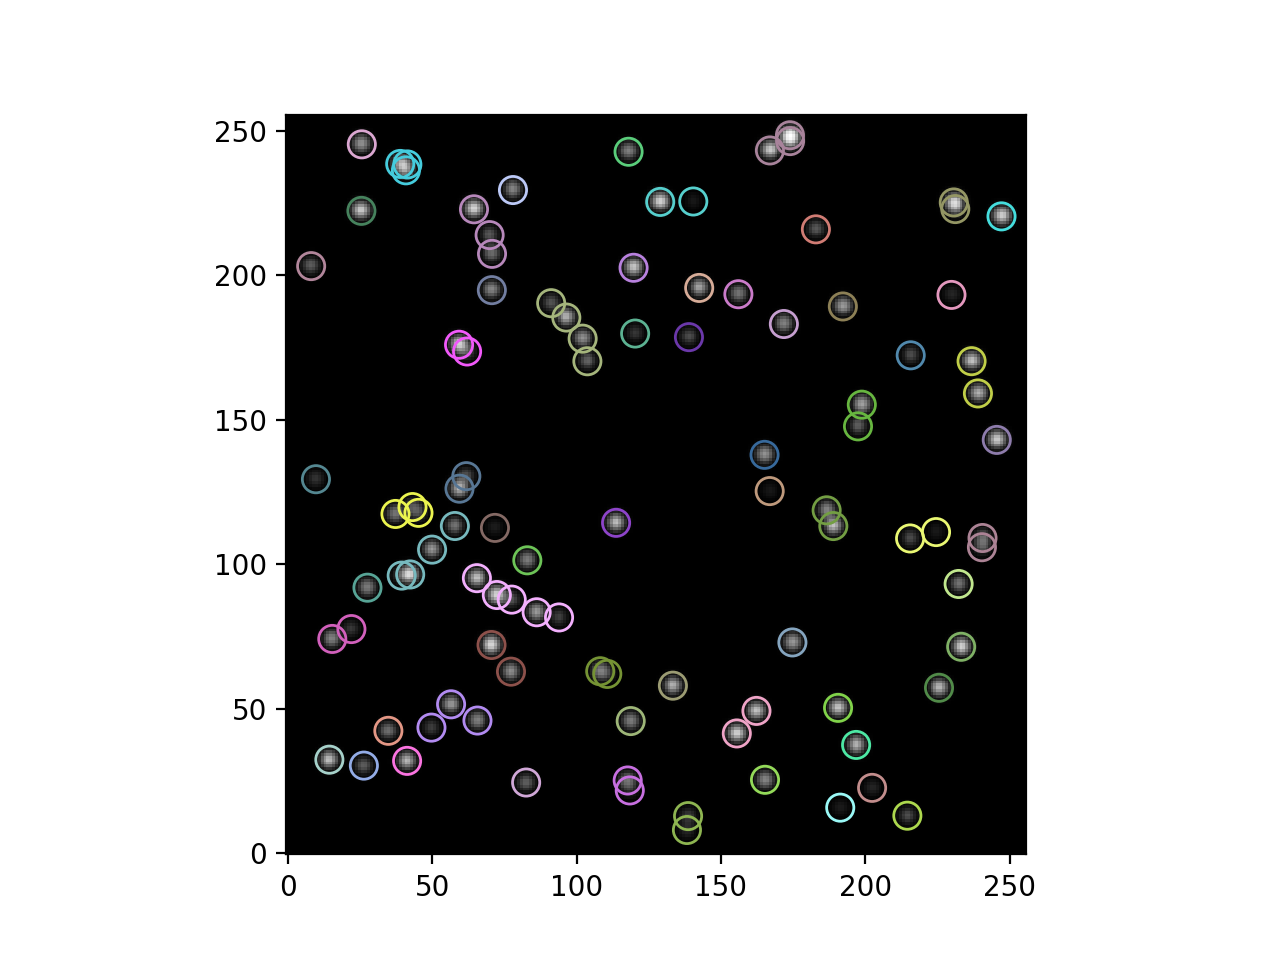
Here the grouping algorithm separated the 100 stars into 65 distinct groups:
>>> print(max(groups))
65
Finally, let’s plot a circular aperture around each star, where stars in the same group have the same aperture color:
>>> import numpy as np
>>> from photutils.aperture import CircularAperture
>>> from photutils.utils import make_random_cmap
>>> plt.imshow(data, origin='lower', interpolation='nearest',
...            cmap='Greys_r')
>>> cmap = make_random_cmap(seed=123)
>>> for i in np.arange(1, max(groups)):
>>>     mask = groups == i
>>>     xypos = zip(x[mask], y[mask])
>>>     ap = CircularAperture(xypos, r=fwhm)
>>>     ap.plot(color=cmap.colors[i])
>>> plt.show()
(Source code, png, hires.png, pdf, svg)

Reference/API
This module provides classes to perform grouping of stars.
Classes
|
Class to group sources into clusters based on a minimum separation distance. |