detect_sources#
- photutils.segmentation.detect_sources(data, threshold, n_pixels, *, connectivity=8, mask=None)[source]#
Detect sources above a specified threshold value in an image.
Detected sources must have
n_pixelsconnected pixels that are each greater than thethresholdvalue in the inputdata. The inputmaskcan be used to mask pixels in the input data. Masked pixels will not be included in any source.This function does not deblend overlapping sources. First use this function to detect sources followed by
deblend_sources()to deblend sources. Alternatively, use theSourceFinderclass to detect and deblend sources in a single step.- Parameters:
- data2D
ndarray The 2D array of the image. If filtering is desired, please input a convolved image.
- thresholdfloat or 2D
ndarray The data value or pixel-wise data values to be used for the detection threshold. If
datais aQuantityarray, thenthresholdmust have the same units asdata. A 2Dthresholdarray must have the same shape asdata.- n_pixelsint
The minimum number of connected pixels, each greater than
threshold, that an object must have to be detected.n_pixelsmust be a positive integer.- connectivity{4, 8}, optional
The type of pixel connectivity used in determining how pixels are grouped into a detected source. The options are 4 or 8 (default). 4-connected pixels touch along their edges. 8-connected pixels touch along their edges or corners.
- mask2D bool
ndarray, optional A boolean mask, with the same shape as the input
data, whereTruevalues indicate masked pixels. Masked pixels will not be included in any source.
- data2D
- Returns:
- segment_image
SegmentationImageorNone A 2D segmentation image, with the same shape as
data, where sources are marked by different positive integer values. A value of zero is reserved for the background. If no sources are found thenNoneis returned.
- segment_image
- Raises:
- NoDetectionsWarning
If no sources are found.
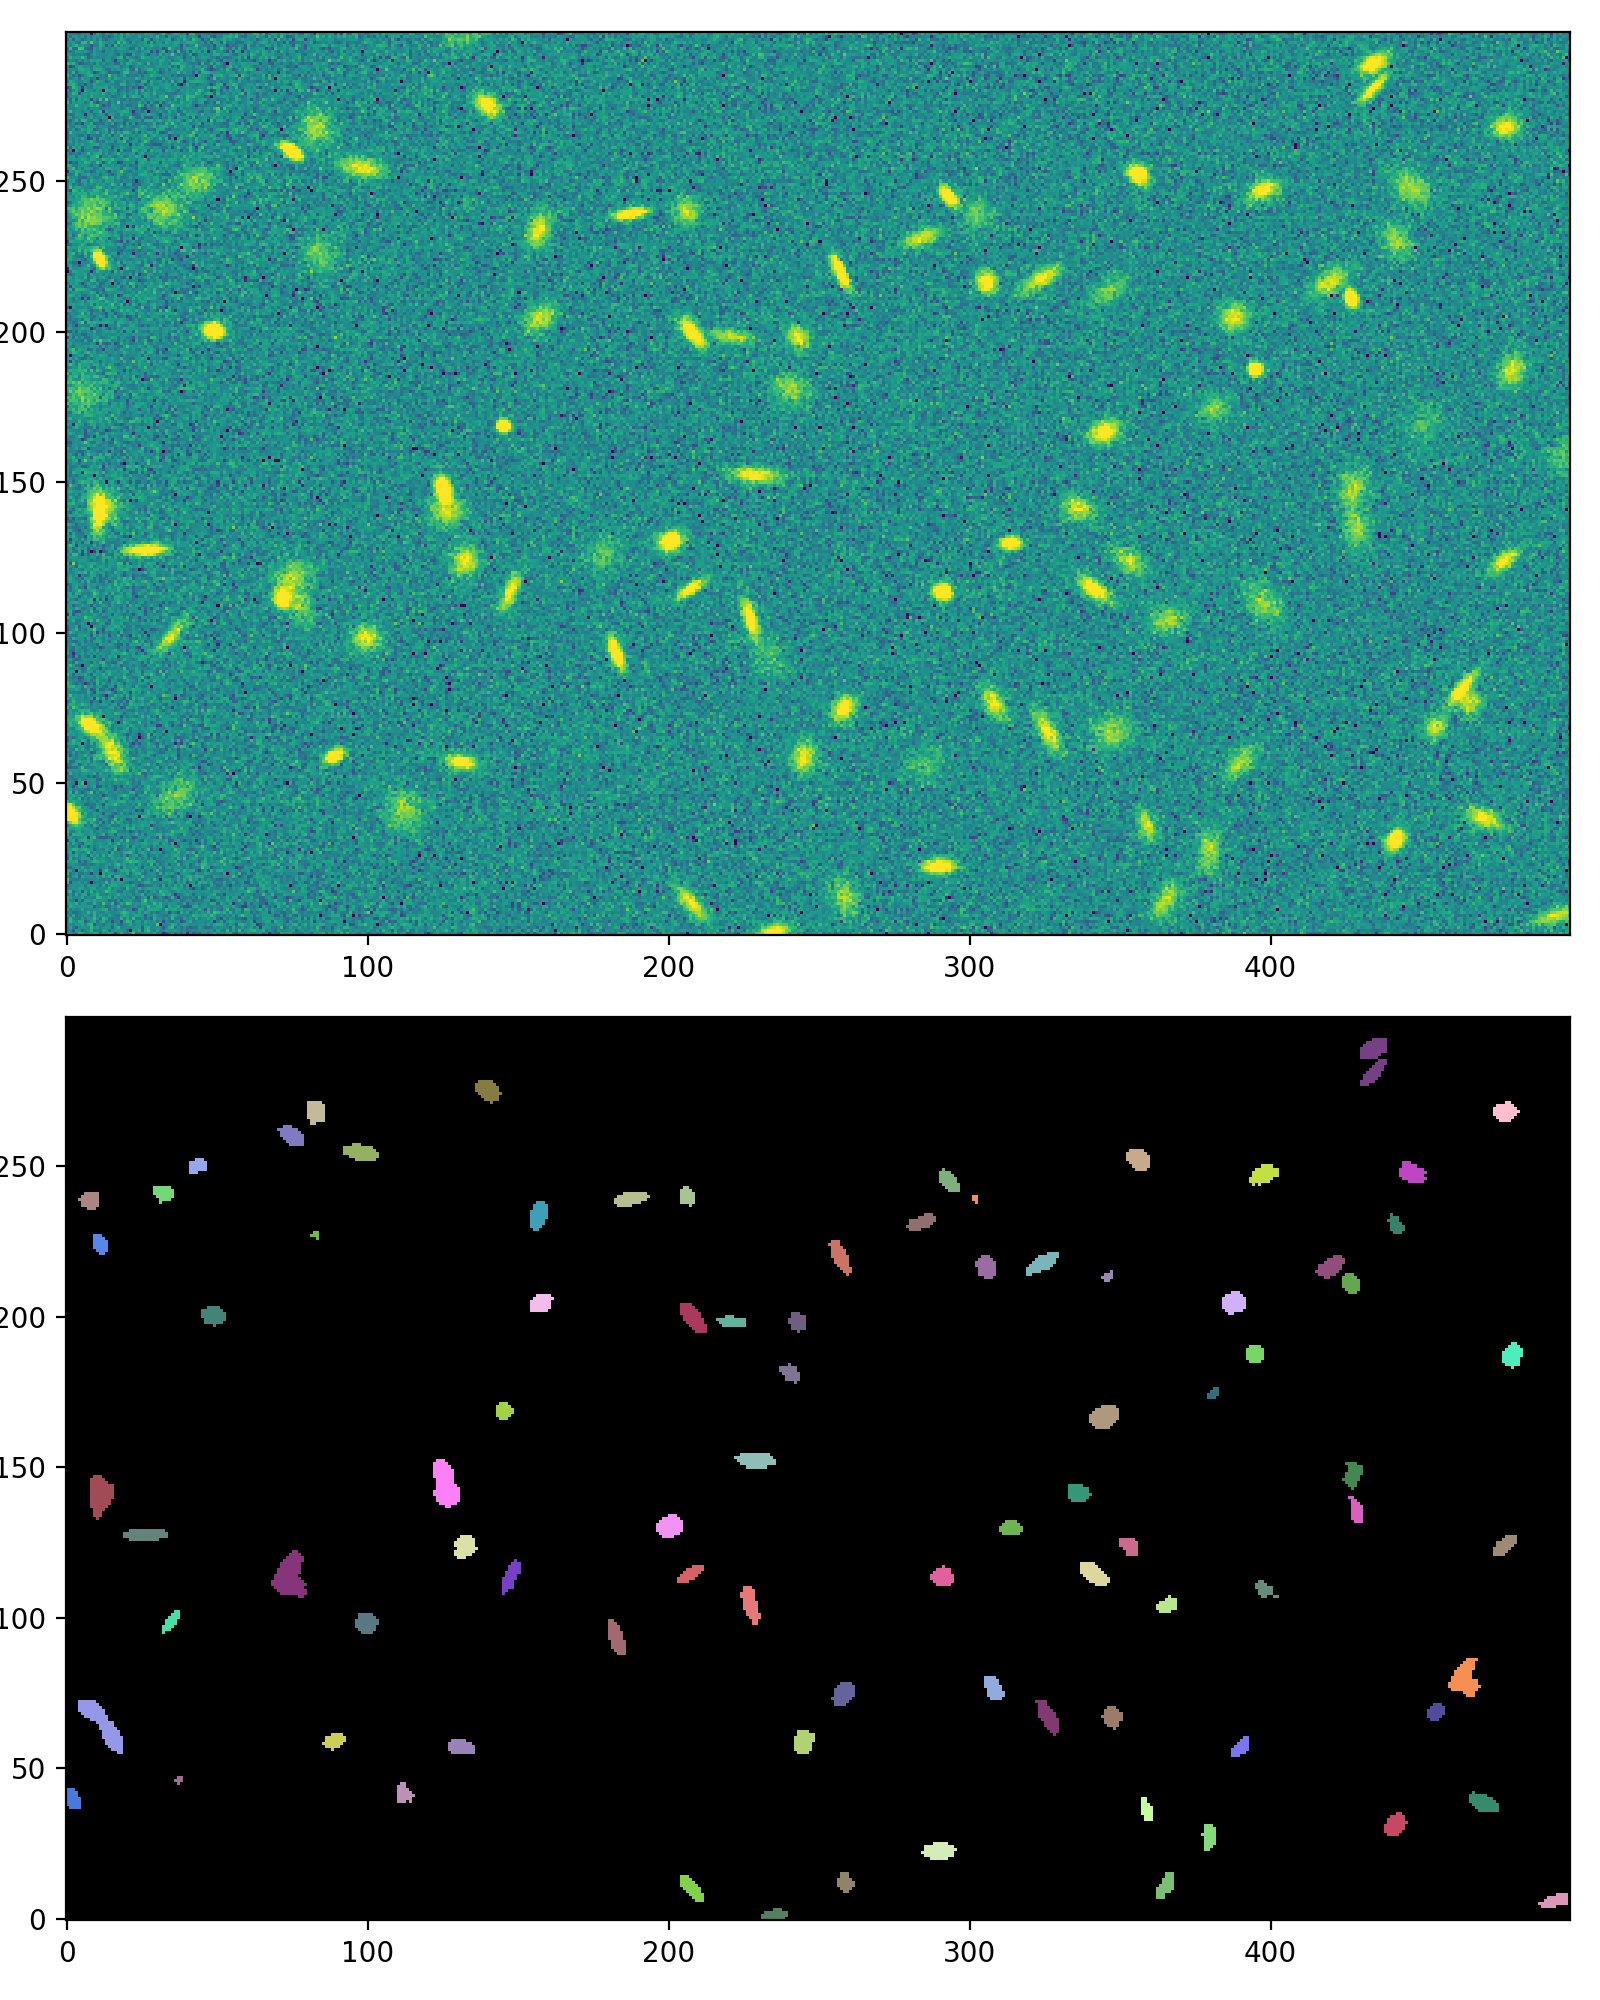
Examples
import matplotlib.pyplot as plt
from astropy.convolution import convolve
from astropy.visualization import simple_norm
from photutils.background import Background2D, MedianBackground
from photutils.datasets import make_100gaussians_image
from photutils.segmentation import (detect_sources,
                                    make_2dgaussian_kernel)

# Make a simulated image
data = make_100gaussians_image()

# Estimate the background using Background2D and subtract it
bkg_estimator = MedianBackground()
bkg = Background2D(data, (50, 50), filter_size=(3, 3),
                   bkg_estimator=bkg_estimator)
data -= bkg.background  # subtract the background

# Convolve the data
kernel = make_2dgaussian_kernel(3.0, size=5)
convolved_data = convolve(data, kernel)

# Detect the sources
threshold = 1.5 * bkg.background_rms  # set the detection threshold
segment_map = detect_sources(convolved_data, threshold, n_pixels=10)

# Plot the image and the segmentation image
fig, (ax1, ax2) = plt.subplots(2, 1, figsize=(8, 10))
norm = simple_norm(data, 'sqrt', percent=99.5)
ax1.imshow(data, norm=norm, origin='lower')
segment_map.imshow(ax=ax2)
fig.tight_layout()
(
Source code,png,hires.png,pdf,svg)